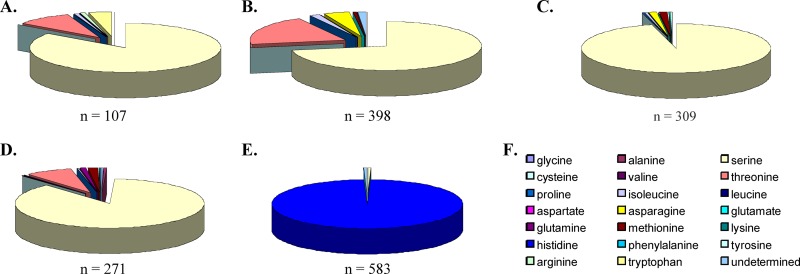
Fig 3.
Frequency of amino acid variability at gp120 position 375 according to HIV-1 subtype designate. Env sequences of subtype A, B, C, D, and CR01_AE (A, B, C, D, and E, respectively) obtained from the Los Alamos database were analyzed in order to determine the frequency of amino acid variability at gp120 position 375. Pie charts depict frequency of the amino acid indicated by color (F). Number of sequences analyzed per subtype designate is indicated at the bottom of each respective pie chart. A total of 1,669 sequences were analyzed.

