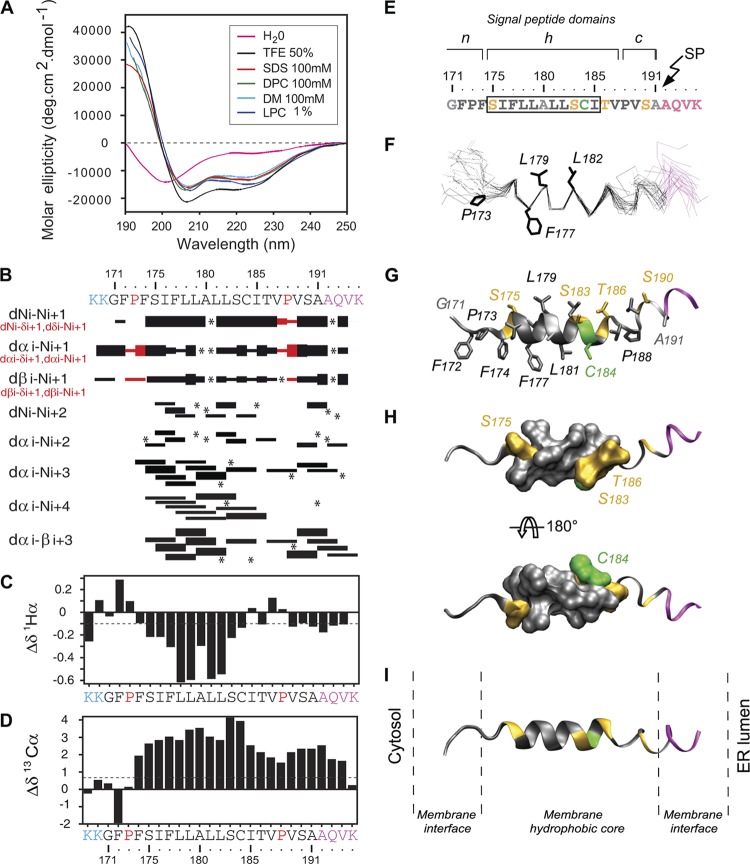
Fig 5.
Structural analyses of the sp-E1 synthetic peptide. (A) Far-UV circular dichroism (CD) analysis of sp-E1 in various environments (the sp-E1 amino acid sequence is shown at the top of panel B). CD spectra were recorded in water (H2O), complemented with either 50% 2,2,2-trifluoroethanol (TFE), 1% l-α-lysophosphatidyl choline (LPC), or the following detergents: 100 mM sodium dodecyl sulfate (SDS), 100 mM N-dodecyl-β-d-maltoside (DM), or 100 mM dodecyl phosphocholine (DPC). (B to D) NMR analysis of the sp-E1 peptide in 50% TFE. The two lysine residues in blue at the N terminus were added to increase the solubility of the peptide. The four C-terminal residues in magenta correspond to the first residues of the E1 glycoprotein. (B) Summary of sequential (i, i + 1) and medium-range (i, i + 2 to i, i + 4) NOEs. Sequential NOEs allowing the assignment of proline residues are indicated in red. Asterisks indicate that the presence of an NOE cross peak was not confirmed because of overlapping resonances. Intensities of NOEs are indicated by the heights of the bars. (C and D) NMR-derived 1H-α (C) and 13C-α (D) chemical shift differences were calculated by the subtraction of the experimental values from the reported random-coil-conformation values in TFE (28). The dashed lines indicate the standard threshold value of ΔH-α (−0.1 ppm) (C) or ΔC-α (0.7 ppm) (D) for an α-helix. (E) Amino acid sequence of the core-E1 signal peptide from strain JFH1 (amino acid residues 171 to 191), including the first four residues of the E1 glycoprotein (shown in magenta at the C terminus). The box indicates α-helix residues 175 to 185, revealed by NMR. Residues are color coded according to their physicochemical properties: hydrophobic residues are black, neutral residues (Ala and Gly) are gray, polar residues (Ser and Thr) are yellow, and Cys is green. The characteristic structural topology of signal peptide domains is indicated at the top, including the N-terminal domain (n), the hydrophobic core region (h), and the C-terminal domain (c) (53) (see the text for details). (F) Superimposition of the backbone heavy atoms (N, C′, and C-α) of the 27 final structures (PDB accession number 2kqi), calculated by using the standard simulated annealing protocol in the Xplor-NIH 2.2.1 program (44). The 27 structures were superimposed for the best overlap of residues 175 to 185. Average positions of side-chain residues reported as potential C-terminal residues of the mature core protein (see the text) are displayed (stick representation). (G) Ribbon and stick models of a representative experimental structure of the sp-E1 peptide. Residues are colored based on the chemical properties of their side chains, as indicated above. (H) Two views of the surface of α-helix residues 175 to 185 showing the relatively polar face versus the highly hydrophobic side rotated by 180° (top and bottom views, respectively). (I) Tentative position of the sp-E1 peptide within a phospholipid bilayer of POPC (1-palmitoyl-2-oleoyl-3-sn-glycero-3-phosphocholine) on the same scale. Figures were generated from structure coordinates using VMD (http://www.ks.uiuc.edu/Research/vmd/) (15) and rendered with POV-Ray (http://www.povray.org/).

