
Fig 2.
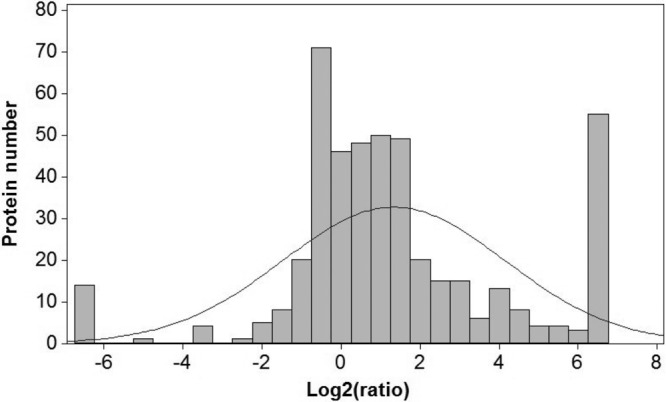
Protein ratio frequency graph illustrating the numbers of cellular proteins with each SILAC ratio (EGFP-NS1/EGFP) in GFP-trap immunoprecipitates. In immunoprecipitation experiments of this type, many of the proteins identified in the immunoprecipitate likely represent experimental contaminants, and an increased abundance ratio indicates an increased likelihood of involvement in a specific interaction. In this study, the majority of the proteins were described by a normal distribution centered around a ratio of 1 log2 unit (2-fold).