Fig 2.
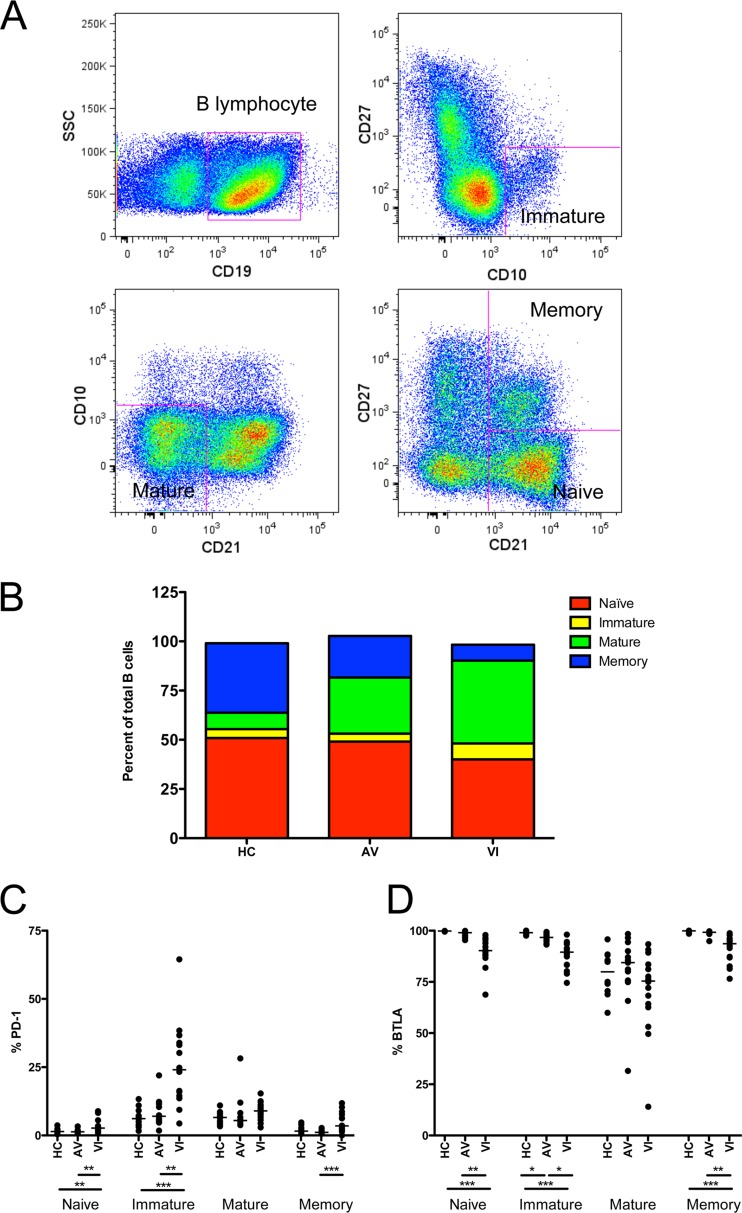
Distribution of B-lymphocyte subsets and expression of PD-1 and BTLA. (A) Flow cytometry gating strategy for separating B cell subsets. Within the B lymphocytes (CD19+), cells were further gated into four subsets, defined as immature (CD10+CD27−), mature (CD10−CD21lo), naive (CD10−CD21hiCD27−), and memory (CD10−CD21hiCD27+). (B) Mean proportions of naive, immature, mature, and memory subsets within the total B cell population in HC, AV, and VI subjects. (C and D) Percentages of naive, immature, mature, and memory B cells that express PD-1 (C) and BTLA (D) in HC, AV, and VI. Each point represents data from a single subject. Horizontal bars within the point plots indicate the median percentage for each group. Significance between groups determined by 1-way ANOVA is indicated below the groups: *, P < 0.05; **, P < 0.01; ***, P < 0.001.

