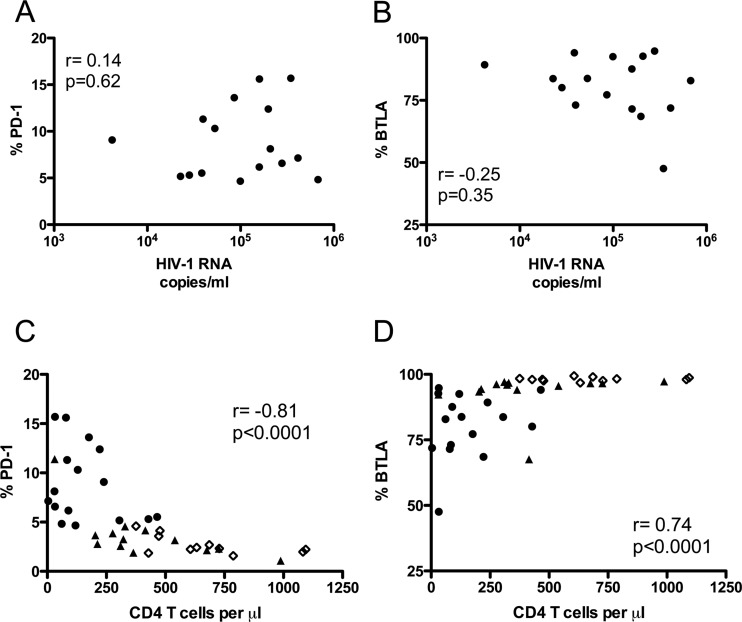
Fig 4.
Correlation of PD-1 and BTLA expression on B lymphocytes with markers of HIV-1 disease progression. (A and B) Correlations between plasma viral load (HIV-1 RNA copies/ml) and percentage of total B cells (CD19+) that express PD-1 (A) or BTLA (B). (C and D) Correlations between blood CD4 count (CD4 T cells/μl) and percentage of total B cells (CD19+) that express PD-1 (C) or BTLA (D). Spearman's rank correlation coefficient (r) and level of significance (p) are indicated in each graph. Each point represents data from a single subject. Open diamonds, HC; closed triangles, AV; closed circles, VI.

