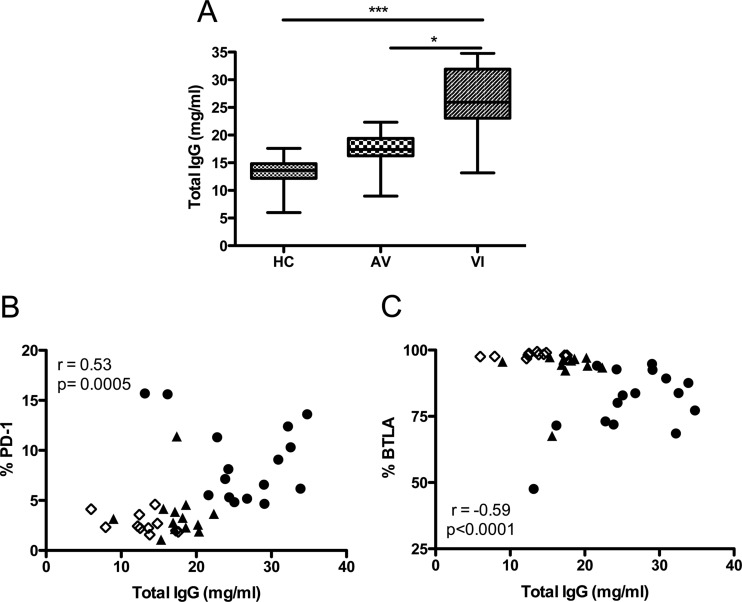
Fig 5.
Correlation of PD-1 and BTLA expression on B lymphocytes with total plasma IgG levels. (A) Concentrations of total IgG (mg/ml) in the plasma of HC, AV, and VI subjects. Horizontal lines within the boxes indicate the median value for each group. Boxes represent the 25th to 75th percentiles, and brackets represent the minimum to maximum values in each group. Significance between groups by 1-way ANOVA is indicated above the groups: *, P < 0.05; ***, P < 0.001. (B and C) Correlations between total IgG concentration (mg/ml) in plasma and percentage of total B cells (CD19+) that express PD-1 (B) or BTLA (C). Spearman's rank correlation coefficient (r) and level of significance (p) are indicated within each graph. Each point represents data from a single subject. Open diamonds, HC; closed triangles, AV; closed circles, VI.

