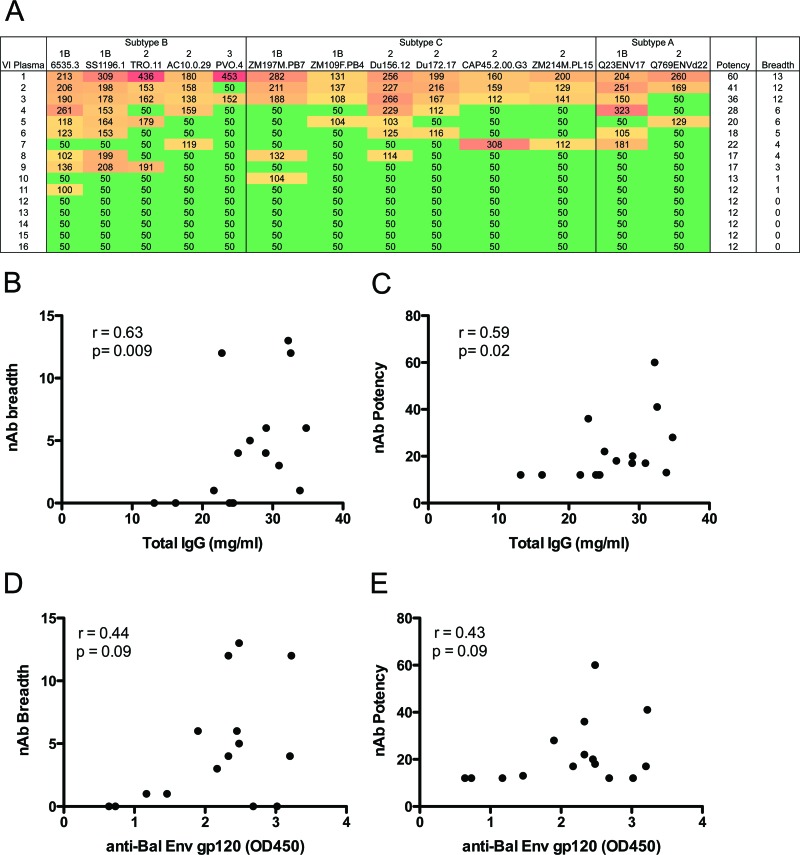
Fig 6.
Neutralization breadth of plasma from VI subjects correlates with total IgG level. Sixteen plasma samples from VI were evaluated for their neutralization breadth and potency against a cross-clade panel of 13 HIV-1 Env pseudotypes. (A) The neutralization IC50 was calculated for each plasma-Env combination using linear regression. IC50s of less than 1:100 were assigned a value of 1:50. Color shading indicates the potency of neutralization: red > dark orange > light orange > green. HIV-1 Envs are listed along the top and are grouped by subtype. The tier designation for each Env (1B, 2, or 3) is shown and represents overall neutralization phenotype, as described in reference 45. Tier 1B viruses are “easy” to neutralize; tier 2 viruses are representative of most patient viruses; tier 3 viruses are “difficult” to neutralize. Higher breadth and potency scores indicate greater neutralization capacity. (B and C) Correlations between neutralization breadth (the number of Env pseudotypes neutralized) or potency (the sum of IC50s for each plasma-Env combination divided by the median IC50 for that virus against all plasma samples) and total IgG level for each plasma sample. (D and E) Correlations between nAb breadth and potency and the level of anti-gp120 binding antibodies in plasma, detected by ELISA (plotted as the optical density reading at 450 nm). Spearman's rank correlation coefficient (r) and level of significance (p) are indicated within each graph. Results given in panels D and E showed positive r values and trended toward significance but did not reach a level of P < 0.05.

