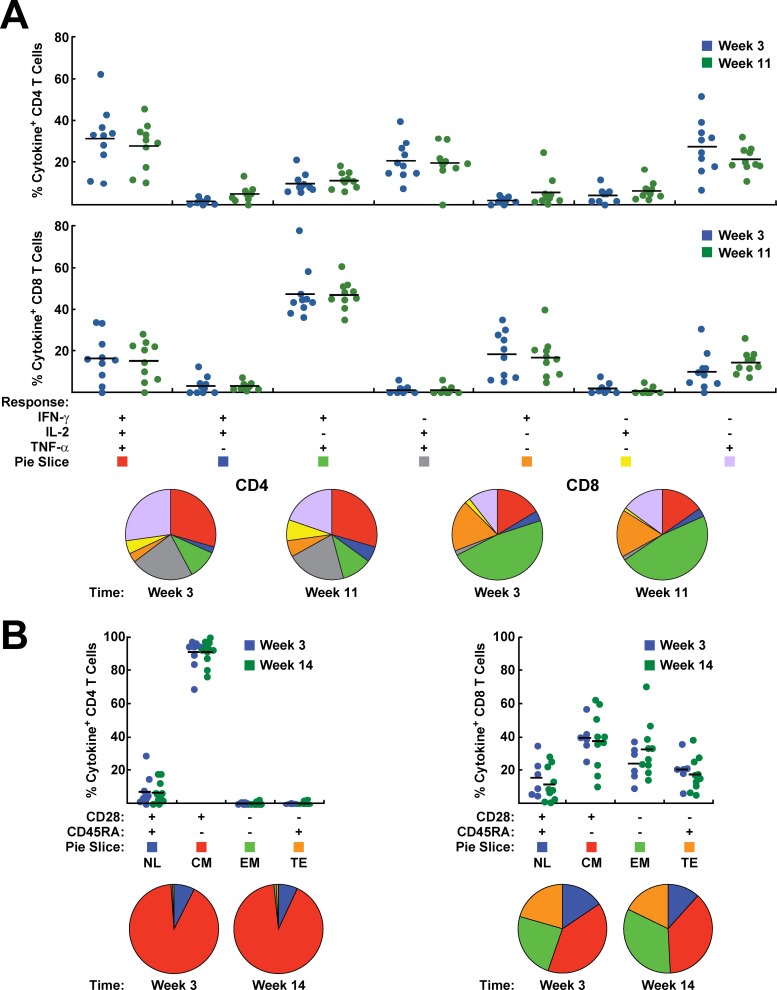
Fig 6.
Polyfunctionality and phenotypes of T-cell responses after prime and boost immunization. The frequency of cytokine production after stimulation with a peptide pool for Env was determined by intracellular cytokine staining for IFN-γ, IL-2, and TNF-α at weeks 3 and 11. The results are shown in bar charts and pie charts. (A) CD4+ and CD8+ T-cell responses are shown separately for each of the 7 functional subsets. Red, 3 functions; blue, green, and gray, 2 functions; orange, yellow, and purple, 1 function. (B) Analysis of cytokine production based on the expression of CD28 and CD45RA. NL, naïve-like; CM, central memory; EM, effector memory; TE, terminal effector.

