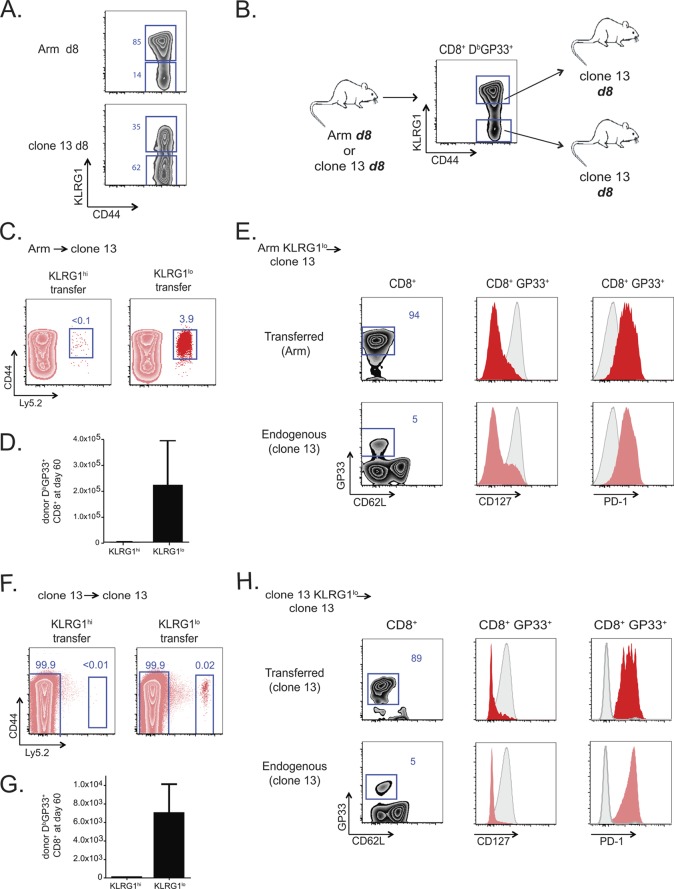
Fig 5.
Exhausted virus-specific CD8 T cells arise from the KLRG1lo memory precursor population of effector cells. (A) KLRG1 expression on day 8 p.i. with Arm and clone 13. (B) Experimental design. Ly5.2+ CD44hi DbGP33+ CD8 T cells from either day 8 Arm- or day 8 clone 13-infected donor mice were sorted into KLRG1hi and KLRG1lo populations. Equal numbers of virus-specific KLRG1hi- or KLRG1lo-sorted populations were adoptively transferred into day 8 clone 13-infected recipient mice and analyzed at 1 to 2 months p.t. Approximately 2.9 × 10⁵ KLRG1hi or KLRG1lo DbGP33+ CD8 T cells were transferred to each recipient in the Arm → clone 13 experiment, and 1.4 × 10⁵ cells were transferred in the clone 13 → clone 13 control experiment. (C to E) KLRG1hi and KLRG1lo CD8+ DbGP33+ T cells from day 8 Arm-infected mice adoptively transferred into day 8 clone 13-infected recipients. (C) Representative plots of the endogenous (Ly5.2-negative [Ly5.2−]) and KLRG1-sorted (Ly5.2+) donor populations at 2 months p.t.; (D) absolute number of each transferred population on day 60 p.t.; (E) representative plots from KLRG1lo recipient mice on day 60 p.t. The mean fluorescence of CD127 and PD-1 is shown in red or pink, with CD8+ CD44lo naïve T cells shown in the gray histograms. (F and G) KLRG1hi or KLRG1lo CD8+ DbGP33+ T cells from day 8 clone 13-infected mice adoptively transferred into day 8 clone 13-infected recipients. (F) Representative plots of the endogenous (Ly5.2−) and KLRG1-sorted (Ly5.2+) donor populations at 2 months p.t.; (G) absolute number of each transferred population on day 60 p.t. (H) Representative plots from KLRG1lo recipient mice on day 60 p.t. The mean fluorescence of CD127 and PD-1 is shown in red or pink, with CD8+ CD44lo naïve T cells shown in the gray histograms.

