Fig 3.
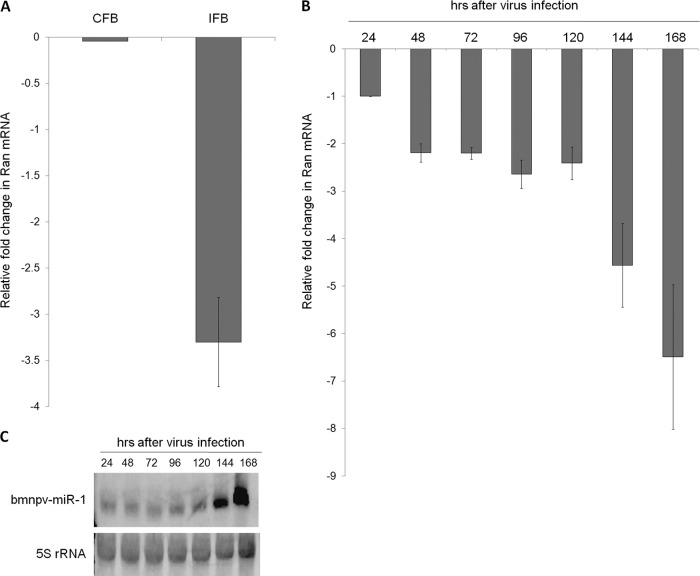
Expression of Ran decreases as the bmnpv-miR-1 level increases post-BmNPV infection in B. mori larvae. (A) RT-qPCR analysis of Ran transcripts from control fat body (CFB) tissues and BmNPV IFB tissues 4 days postinfection. (B) Ran transcript levels upon BmNPV infection at different time points examined by RT-qPCR in larvae. Each of the reactions was performed in triplicate three times independently, and the results were normalized against endogenous 18S rRNA. The data are presented as means ± SD (n = 3). (C) bmnpv-miR-1 expression analyzed by Northern blotting in BmNPV-infected RNA samples used in the experiment shown in panel B. The blots were probed with bmnpv-miR-1 (top) and 5S rRNA (bottom), an endogenous control.

