
Fig 9.
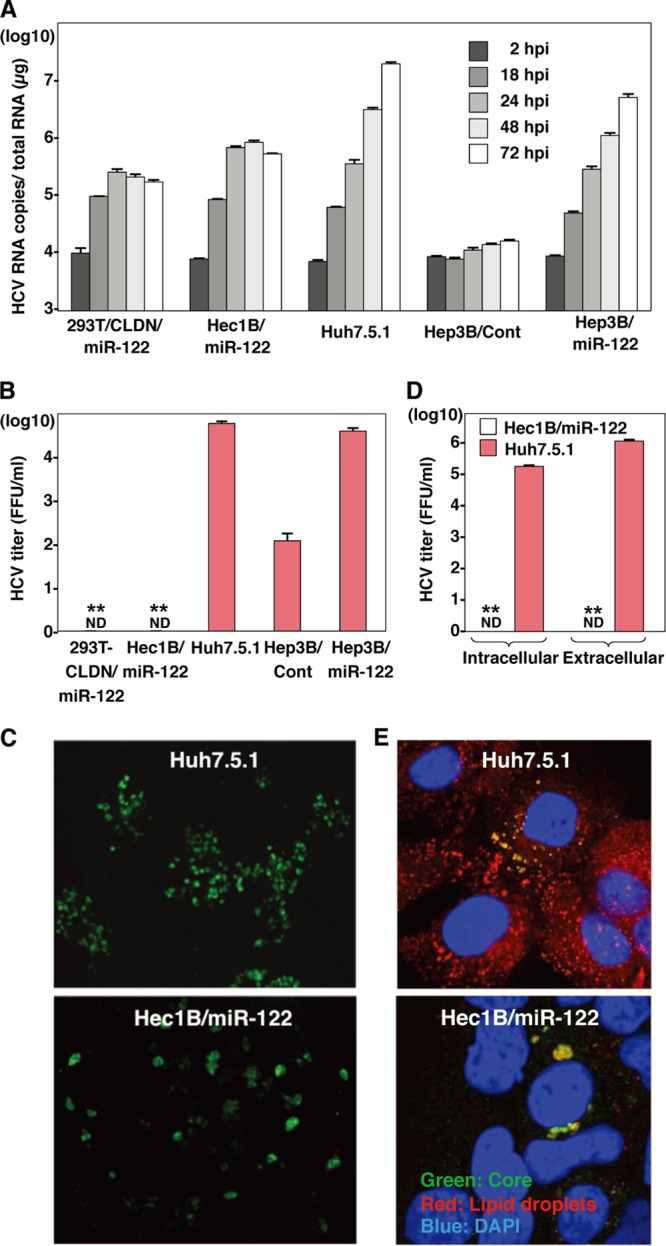
Viral particle formation in hepatic and nonhepatic cells. (A) HCVcc was inoculated into 293T-CLDN/miR-122, Hec1B/miR-122, Hep3B/Cont, and Hep3B/miR-122 cells at an MOI of 1 and into Huh7.5.1 cells at an MOI of 0.1. HCV RNA levels (copies/μg) in cells at 2, 18, 24, 48, and 72 h postinfection were determined by qRT-PCR. (B) HCVcc was inoculated into 293T-CLDN/miR-122, Hec1B/miR-122, Hep3B/Cont, and Hep3B/miR-122 cells at an MOI of 1 or into Huh7.5.1 cells at an MOI of 0.1, and infectious titers in the culture supernatants were determined at 72 h postinfection by a focus-forming assay in Huh7.5.1 cells. ND, not determined. (C) Huh7.5.1 and Hec1B/miR-122 cells were infected with HCVcc at MOIs of 0.1 and 1, respectively, incubated with 1% methylcellulose in DMEM containing 10% FCS for 72 h, fixed with 4% PFA, and subjected to immunofluorescence analysis using anti-NS5A antibody. (D) Hec1B/miR-122 and Huh7.5.1 cells were infected with HCVcc at MOIs of 1 and 0.1, respectively, and infectious titers in cells and supernatants were determined by a focus-forming assay at 72 h postinfection. (E) Huh7.5.1 and Hec1B/miR-122 cells were infected with HCVcc at MOIs of 0.1 and 1, respectively, fixed with 4% PFA, and subjected to immunofluorescence assay using anti-core protein antibody (green). Lipid droplets and cell nuclei were stained with BODIPY (red) and DAPI (blue), respectively. Asterisks indicate significant differences (**, P < 0.01) versus the results for Huh7.5.1 cells.