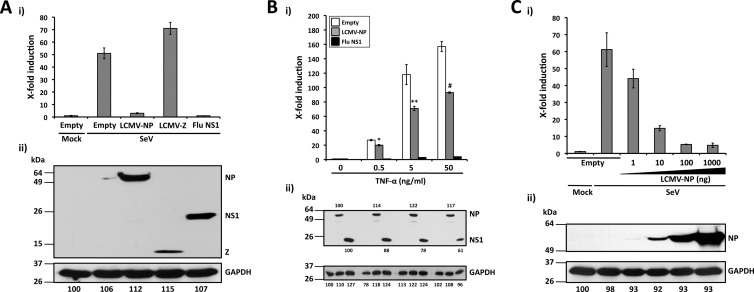
Fig 2.
LCMV-NP inhibition of an NF-κB-dependent promoter. (A) Inhibition by LCMV-NP of SeV-mediated induction of an NF-κB-dependent promoter. The NF-κB-responsive plasmid pNF-κB-Fluc (500 ng) was cotransfected with 2 μg of pCAGGs MCS (Empty) or pCAGGs expressing C-terminal HA-tagged versions of LCMV-NP, LCMV-Z, or influenza virus (Flu) NS1 into 293T cells (12-well format, triplicates), together with 50 ng of the Renilla luciferase expression plasmid pSV40-Ren to normalize transfection efficiencies. At 24 h p.t., cells were mock infected (Mock) or infected with SeV (MOI = 3). Luciferase (i) and protein (ii) expression levels were determined 16 to 18 h p.i. (B) Inhibition of TNF-α-mediated induction of an NF-κB-dependent promoter by LCMV-NP. 293T cells (12-well format, triplicates) were cotransfected as described for panel A. At 24 h p.t., cells were treated with the indicated amounts of TNF-α. Activation of the NF-κB reporter plasmid (i) and protein expression levels (ii) were determined 16 to 18 h post-TNF-α treatment. Statistical significance of differences in NF-κB-dependent promoter induction between empty plasmid and LCMV-NP-transfected cells (*, P = 0.002 [TNF-α at 0.5 ng/ml]; **, P = 0.022 [TNF-α at 5 ng/ml]; #, P = 0.006 [TNF-α at 50 ng/ml]) was determined using a 2-tailed paired Student's t test. (C) SeV-mediated activation of the NF-κB-dependent promoter is inhibited by LCMV-NP in a dose-dependent manner. 293T cells (12-well plate format, triplicates) were cotransfected as described for panel A. At 24 h p.t., cells were mock infected (Mock) or infected with SeV (MOI = 3). Luciferase (i) and protein (ii) expression levels were determined 16 to 18 h p.i. (A to C) Reporter gene activation is expressed as fold induction over the level seen with the empty vector-transfected and mock-infected control cells. Cell lysates (100 μg of total protein) from the same transfected cells were used to assess protein expression levels by Western blotting using a polyclonal anti-HA antibody. GAPDH was used as a loading control. The GAPDH band intensity in the first lane (empty plasmid and mock infected) was assigned a value of 100% and used to normalize GAPDH levels in the remaining lanes (bottom numbers). Expression levels of each viral protein were normalized with respect to GAPDH for the same sample. Molecular mass markers (kDa) are indicated on the left and viral proteins on the right.

