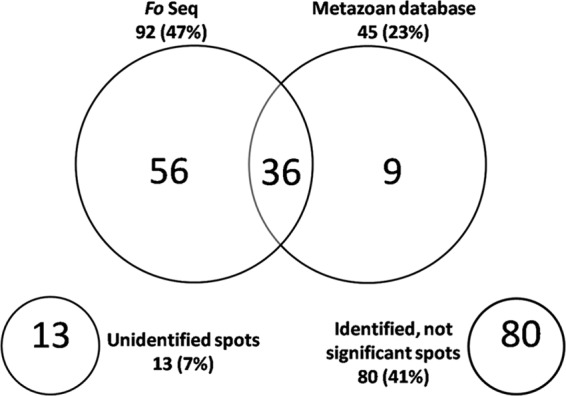
Fig 2.

Venn diagram of the identified proteins from healthy Frankliniella occidentalis first-instar larvae. The large circles display the number and proportion (in parentheses) of proteins that were identified using the Fo Seq and the Metazoan nr protein database from NCBI. The overlap indicates the number of proteins that were identified with both databases, while the numbers inside each circle represent the proteins that were unique to either database. The small circles display the number and proportion (in parentheses) of proteins that were unidentified or identified without having significant matches.
