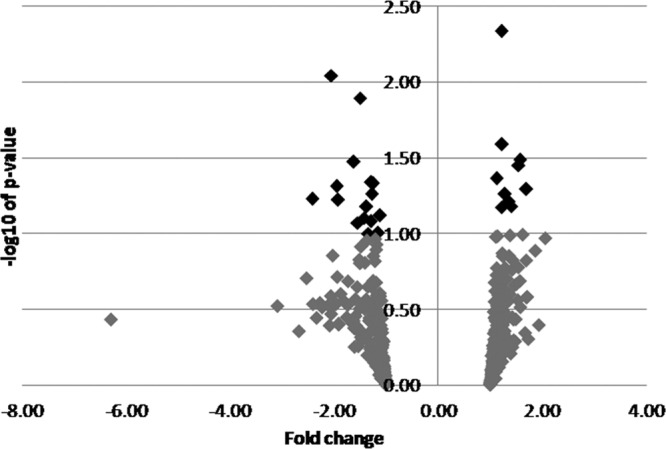
Fig 5.

Volcano plot of protein spots from the analysis of differentially expressed proteins between TSWV-exposed and non-exposed Frankliniella occidentalis first-instar larvae. The relative abundances of the differentially expressed protein spots from the 4 biological replicates performed are presented in the volcano plot as dark diamonds. The direction of the change (up- or downregulation) of protein spots that were differentially expressed between treatments is shown as fold change on the x axis, while the magnitude of the change as −log10 P value is shown on the y axis.
