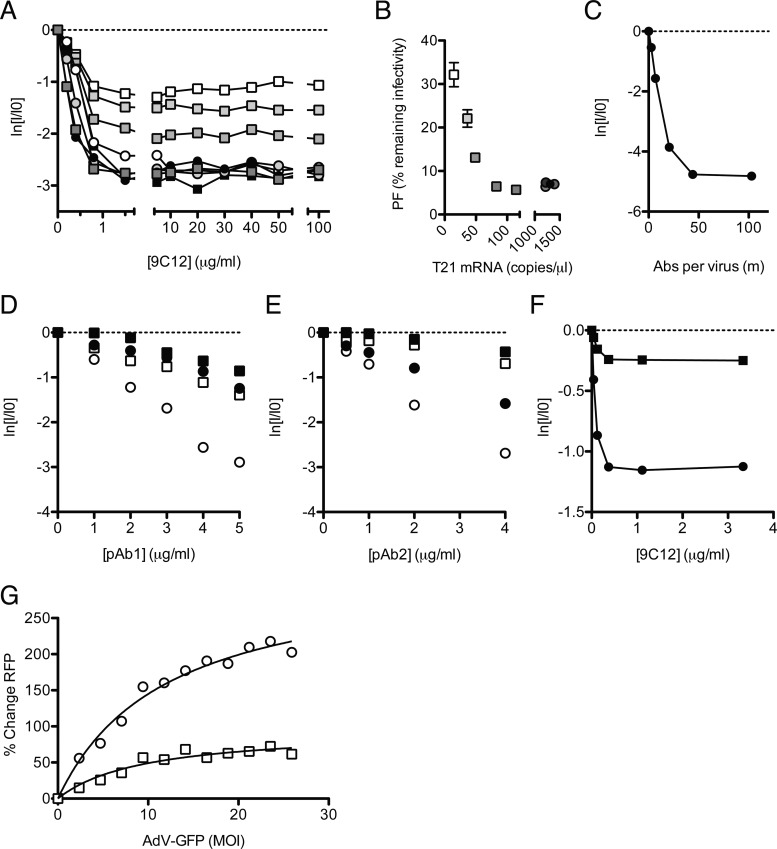
Fig 4.
Infection and persistence are influenced by the neutralization mechanism and viral MOI. (A) Neutralization data from Fig. 3D are shown with the x axis extended to show the persistent fraction range. The PF remains approximately constant within the range of 1.5 to 100 μg/ml 9C12, but its level is determined by the cellular TRIM21 concentration. (B) The average PF, calculated from all data at ≥5 μg/ml 9C12 (n = 7) (±standard errors of the means), decreases with TRIM21 levels before remaining constant at ∼6% remaining infectivity. Symbols and shading as for Fig. 3D (C) Remaining infectivity of adenovirus, assayed alongside a fluorescence pelleting assay, permitting quantification of the number of antibody molecules per virus in the persistent fraction. (D and E) Two polyclonal sera, pAb1 (D) and pAb2 (E), were titrated against AdV on HeLa cells (circles) or HeLa cells treated with siRNA directed toward TRIM21 (squares), which were either IFN stimulated (open symbols) or untreated (closed symbols). (F) Remaining infectivity after AdV was permitted to adsorb to the surface of HeLa cells before the addition of neutralizing monoclonal antibody 9C12. Symbols are as described above for panels D and E. (G) AdV-GFP, preincubated with 9C12, was added to HeLa (circles) or TRIM21 shRNA knockdown (squares) cells at a range of MOIs. A high MOI of AdV-GFP relieved the neutralization of 9C12-labeled AdV-RFP in HeLa cells but to a lesser extent in TRIM21 knockdown cells. Michaelis-Menten curve fitting (black lines) reveals that the maximal saturation values are significantly different between the two conditions (P = 0.0008 by F test).

