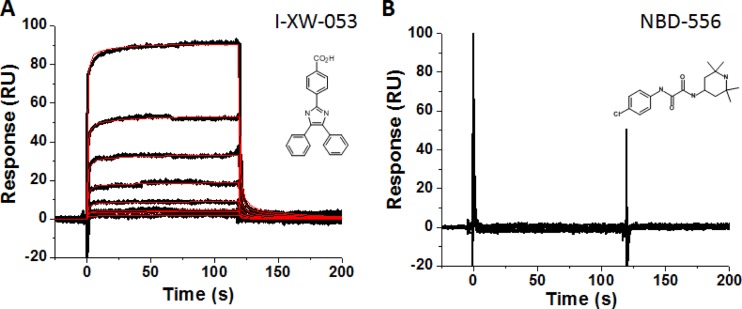
Fig 4.
Sensorgrams depicting the interaction of (A) I-XW-053 and (B) NBD-556 with sensor chip-immobilized HIV-1NL4-3 CA. I-XW-053 at concentrations in the range from 0.86 to 110 μM are shown. Black lines indicate experimental data, whereas red lines indicate fitting to the heterogeneous ligand model. The individual rate constants were out of the dynamic range of the instrument. The equilibrium dissociation constants are as follows: KD1 = 66.3 ± 4.8 μM; KD2 = 66.3 ± 5.2 μM. The chemical structures of each compound are shown as insets.

