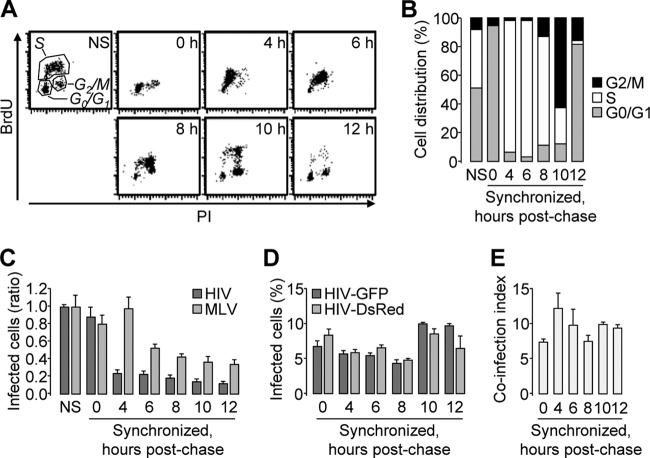
Fig 4.
Determination of the coinfection index in synchronized cells. HeLa cells were arrested in G0/G1, and the cell cycle was allowed to resume. (A and B) Nonsynchronized (NS) and synchronized cells were harvested at the indicated postchase time points following a 1-h incubation in the presence of BrdU. Two-channel BrdU/propidium iodide dot plots (A) and cell distribution throughout the cell cycle phases (B) are shown. (C to E) Nonsynchronized and synchronized cells were incubated with HIV-GFP or MLV-GFP at the indicated postchase time points. (C) The percentage of infected cells was determined by flow cytometry and normalized to that of nonsynchronized cells. (D) HIV-GFP and HIV-DsRed coinfection was analyzed as for Fig. 1. The virus input was adjusted to reach ∼5 to 10% productive infection at all time points with either the DsRed or the GFP reporter virus. (E) The coinfection index was calculated under similar conditions. Representative results of experiments performed at least twice in duplicate are shown. The error bars indicate standard deviations.

