Fig 5.
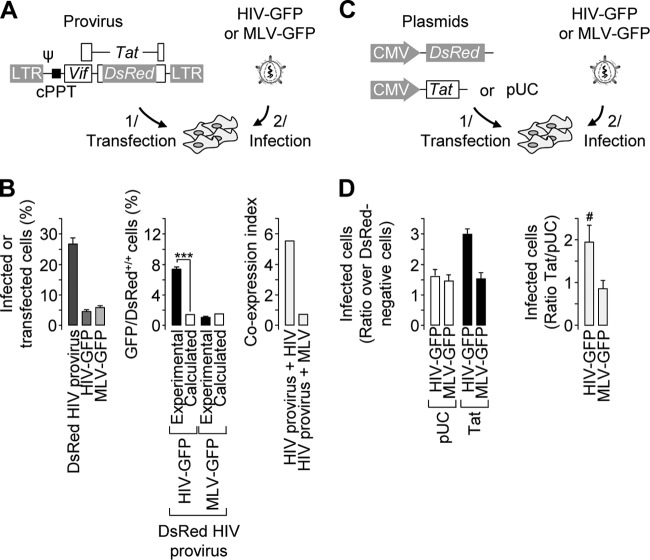
Roles of Gag/Pol and Tat in the biased coinfection events. (A) Schematic representation of the experimental settings. HeLa cells were transfected on day 1 with pHIvec2.DsRed and/or incubated with either a VSV-G-pseudotyped HIV-GFP or MLV-GFP reporter virus on day 2. Psi, HIV-1 packaging signal; cPPT, HIV-1 central polypurine tract. (B) The percentage of transfected or productively infected cells was measured by flow cytometry upon separate transfection/infection (left). The percentage of double-positive cells obtained from the population subjected to both transfection and infection was measured by flow cytometry and compared to the expected results (middle). The coexpression index was obtained by dividing the experimental and expected percentages of double-positive cells (right). Representative results of experiments performed three times in duplicate are shown. Two-proportion z test: ***, z > 3.29, P < 0.001. (C) Schematic representation of the experimental settings. HeLa cells were cotransfected on day 1 with a DsRed-encoding plasmid and either a Tat-encoding plasmid or pUC and infected with either a VSV-G-pseudotyped HIV-GFP or an MLV-GFP reporter virus on day 2. (D) Cells were analyzed by flow cytometry. For each virus, the percentage of GFP-positive cells in the DsRed-positive population was normalized to that in the DsRed-negative population used as an internal control (left). The Tat/pUC ratio was then calculated (right). Representative results and averages of experiments performed 8 times with HIV-GFP and twice with MLV-GFP are shown (left and right, respectively). t test; #, P < 0.005; n = 8). The error bars indicate standard deviations.

