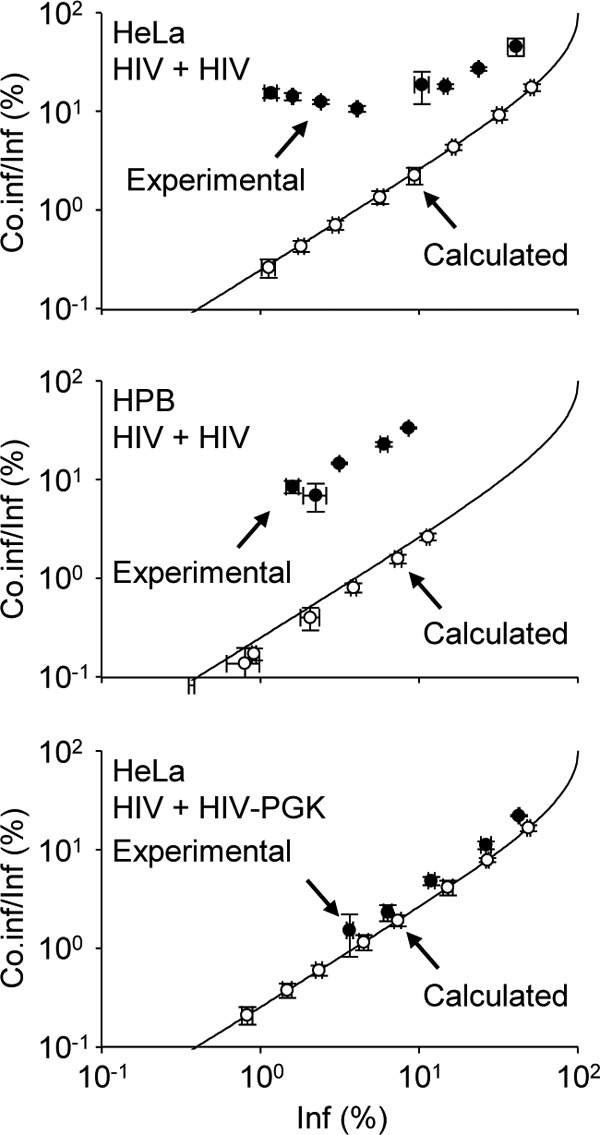
Fig 6.

Coinfection with Tat-dependent and Tat-independent virus is random. Coinfection analyses were performed as for Fig. 1. Using a starting input of GFP and DsRed reporter viruses that ensured similar percentages of productive infection, each virus was serially diluted and incubated with cells either separately or in combination. For each virus input, the experimental and calculated percentages of coinfected cells (Co.inf) among infected cells (Inf) were plotted as a function of the percentage of infected cells. Experimental values were plotted only when the number of coinfection events collected by flow cytometry met the requirements for statistical significance. The Poisson distribution of multiple infection was calculated as described previously (15) and plotted (solid line). HPB-ALL or HeLa cells (top and middle, respectively) were incubated with VSV-G-pseudotyped Tat-dependent GFP and/or DsRed reporter HIV-1 (HIV). Coinfection of HeLa cells with a Tat-dependent DsRed reporter virus (HIV) and a Tat-independent GFP reporter virus (HIV PGK) (bottom) was analyzed and plotted as for the top and middle graphs. Representative results of experiments performed 3 times in duplicate are shown. The error bars indicate standard deviations.
