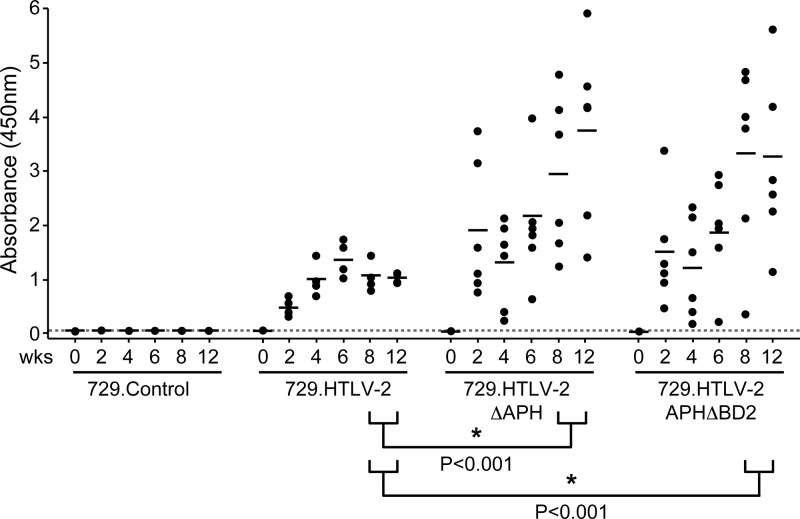
Fig 7.
Assessment of HTLV-2 infection in rabbits. The antibody response against HTLV-2 in each rabbit was measured by a commercial anti-HTLV ELISA, using both HTLV Gag and envelope proteins as antigens. Each dot represents the absorbance value for a single inoculated rabbit at 0, 2, 4, 6, 8, and 12 weeks postinoculation within each group. Inocula used for the rabbits were 729.HTLV-2 (n = 4), 729.HTLV-2ΔAPH (n = 6), 729.HTLV-2APHΔBD2 (n = 6), or 729B (n = 2) cells. The horizontal line represents the average for the rabbit group at each time point, and the dotted line represents 3 times the standard deviation of uninfected control values. Asterisks indicate that the antibody responses in rabbits inoculated with 729.HTLV-2ΔAPH cells and in rabbits inoculated with 729.HTLV-2APHΔBD2 cells are statistically different from those in rabbits inoculated with wtHTLV-2 at week 8 and week 12 postinoculation (P < 0.001 and P < 0.001, respectively). The differences between 729.HTLV-2ΔAPH and 729.HTLV-2APHΔBD2 infections were not statistically significant at any time point (P = 0.7). P values were determined by an ANOVA.

