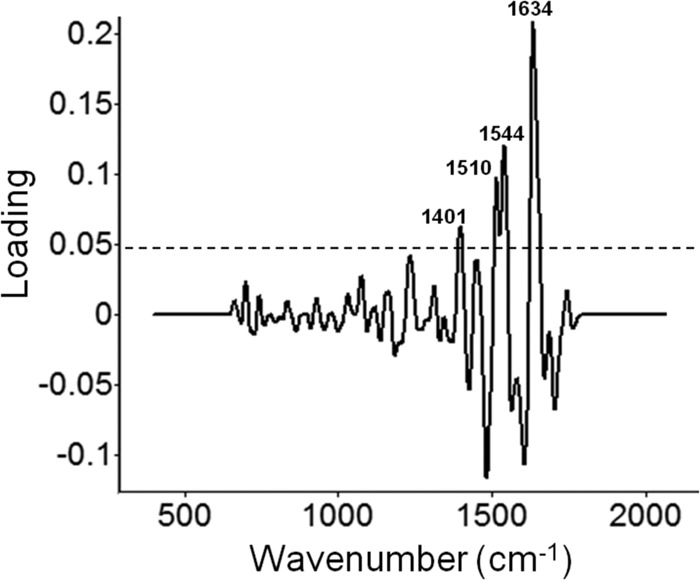
Fig 5.

Loading plot of the first PC obtained from the DFA dendrogram in Fig. 4 to explain the classification of 11 different species of traditional and emerging Campylobacter bacteria. The loading plot explains the contributions of chemical constituents of the bacterial cell membrane to the classification model. Peaks: 1,634 cm−1, amide I; 1,544 cm−1, amide II; 1,510 cm−1, ring breathing modes in the DNA bases; 1,401 cm−1, bending modes of methyl groups of proteins.
