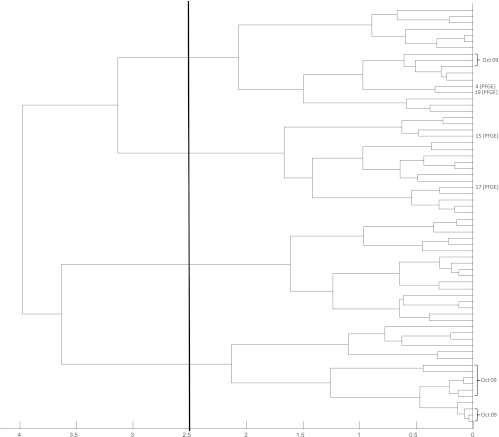
Fig 7.
Dendrogram (representation of hierarchical cluster analysis) of all 66 vanB PCR-positive patient isolates. The four vanB-positive E. faecium isolates from our laboratory shown to be identical by PFGE are shown by their representative number. The 12 vanB-positive isolates from the month with peak incidence (October 2009) are also shown. The vertical line indicates the similarity cutoff of 2.5 arbitrarily chosen for MALDI-TOF MS group definition.

