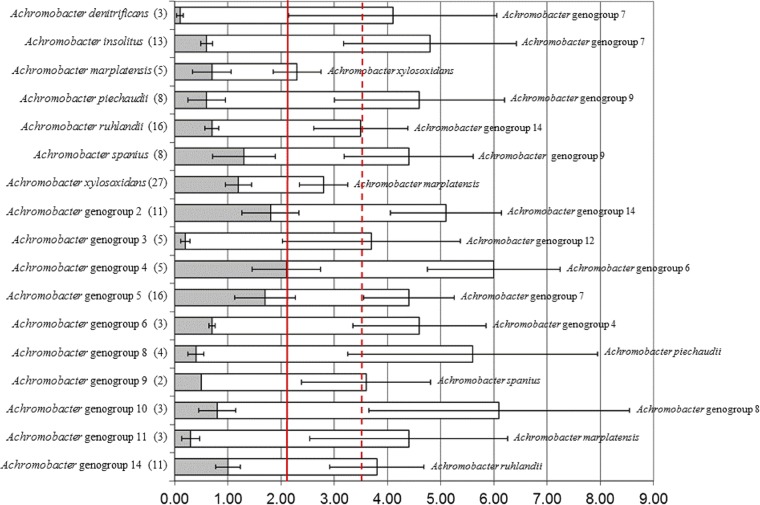
Fig 1.
Nucleotide divergence of concatenated MLST loci. Shaded bars represent divergence within a species/genogroup; open bars represent the divergence between species/genogroup and its closest neighbor (listed to the right), as defined by percentage similarity. Error bars represent the standard errors of the shaded and open bars. The solid line represents maximum intraspecies divergence; the dashed line represents the average interspecies divergence.

