
Fig 2.
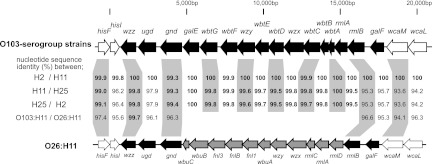
Comparison of O103-antigen biosynthesis gene clusters and their flanking regions. The genetic organization of the O103-antigen gene cluster and its flanking regions from O103 serotype strains is shown at top and that from STEC O26:H11 11368 (AP010953) is shown at the bottom. Genes associated with O-antigen biosynthesis are indicated by black arrows, and flanking genes are indicated by white arrows. O26-specific genes are indicated by gray arrows. Nucleotide sequence identities (%) between O103:H2 and O103:H11, between O103:H11 and O103:H25, and between O103:H25 and O103:H2 are shown in the middle. In addition, sequence identities between O103:H11 and O26:H11 are also shown.