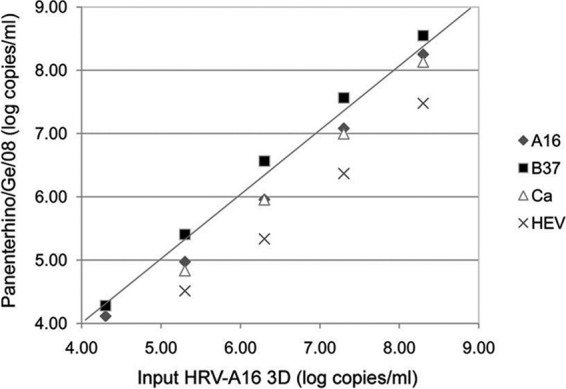
Fig 3.

Experimental evaluation of HRV nucleic acid quantification variation linked to HRV genetic variability. The plot shows chimeric plasmid quantifications expressed in log copies/ml using the Panenterhino/Ge/08 assay (y axis) compared to the HRV-A16 3D values (x axis), using five 10-fold dilutions of chimeric plasmids, ranging from 4.30 to 8.30 copies/ml. Raw data are available in Table S4 in the supplemental material.
