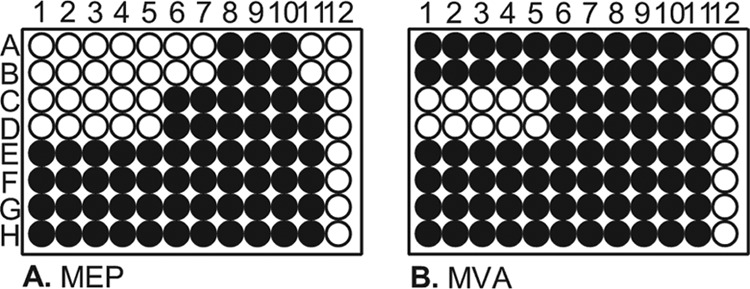
Fig 2.

Expected screening results for the MEP screening platform. Rows A and B represent an MEP pathway-selective inhibitor and rows C and D an antibacterial that is not selective for the MEP pathway; rows E and F and rows G and H are not antibacterial. Wells A11 and B11 are Fos controls, C11 to H11 are no-inhibitor controls, and column 12 represents media blanks. ● = cell growth; ○ = no cell growth.
