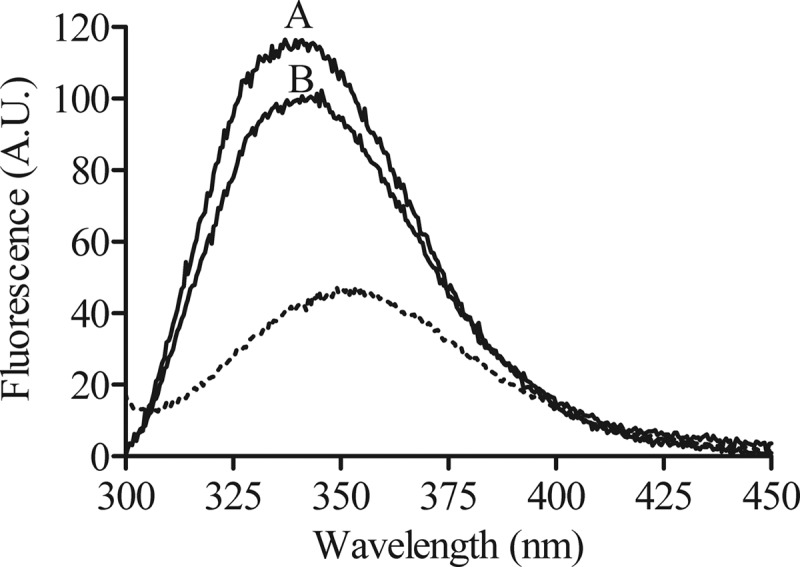
Fig 2.

Fluorescence emission spectra of the tryptophan residue of bovicin HC5 in the absence or presence of model membranes. Spectra were recorded for 1 μM bovicin HC5 in the absence (dotted line) or presence of model membranes composed of DOPC (line A) or DLPC/DMoPC (line B) containing 1 mol% of lipid II. An excitation wavelength of 280 nm was applied, and emission was recorded at between 300 and 450 nm. Spectra were corrected by blank subtraction. The vesicle final concentration used was 100 μM vesicles (lipid-Pi). A.U., arbitrary units.
