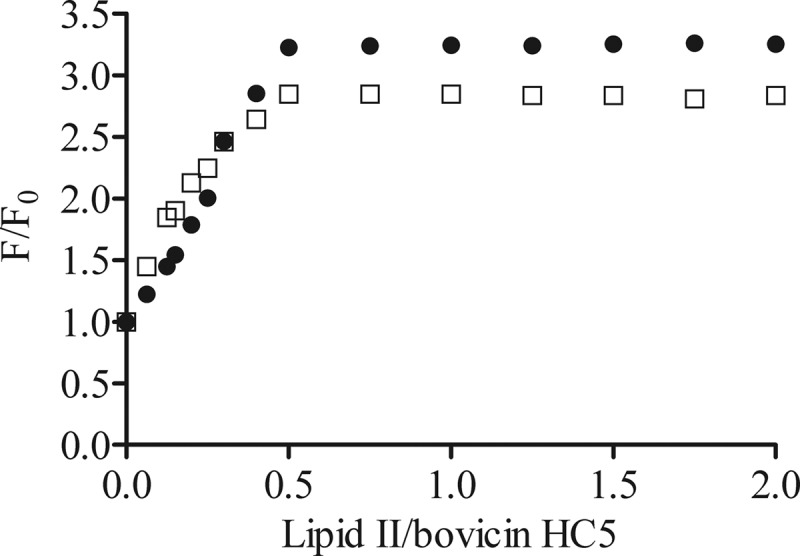
Fig 3.

Lipid II/bovicin HC5 ratio-dependent change in the tryptophan fluorescence of bovicin HC5. Different amounts of DOPC (●) or DLPC/DMoPC (□) vesicles containing 1 mol% of lipid II were added to 1 μM bovicin HC5. Single-wavelength recordings were performed at 340 nm using an excitation wavelength of 280 nm. The fluorescence intensities before (F0) and after addition of lipid II-containing membranes (F) were used to calculate the F/F0 values, which were plotted against the lipid II/bovicin HC5 ratio.
