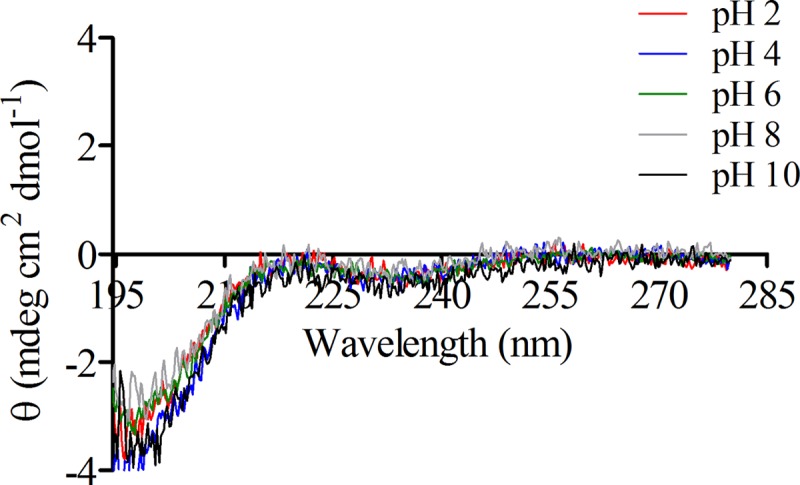
Fig 6.

CD spectra of 20 μM bovicin HC5 in solution (10 mM potassium phosphate, 40 mM potassium sulfate) and at different pHs (from 2 to 10). The samples were scanned from 195 to 280 nm at 20°C. Each spectrum represents an average of five recordings after subtraction of the blank spectrum from each bovicin HC5 spectrum.
