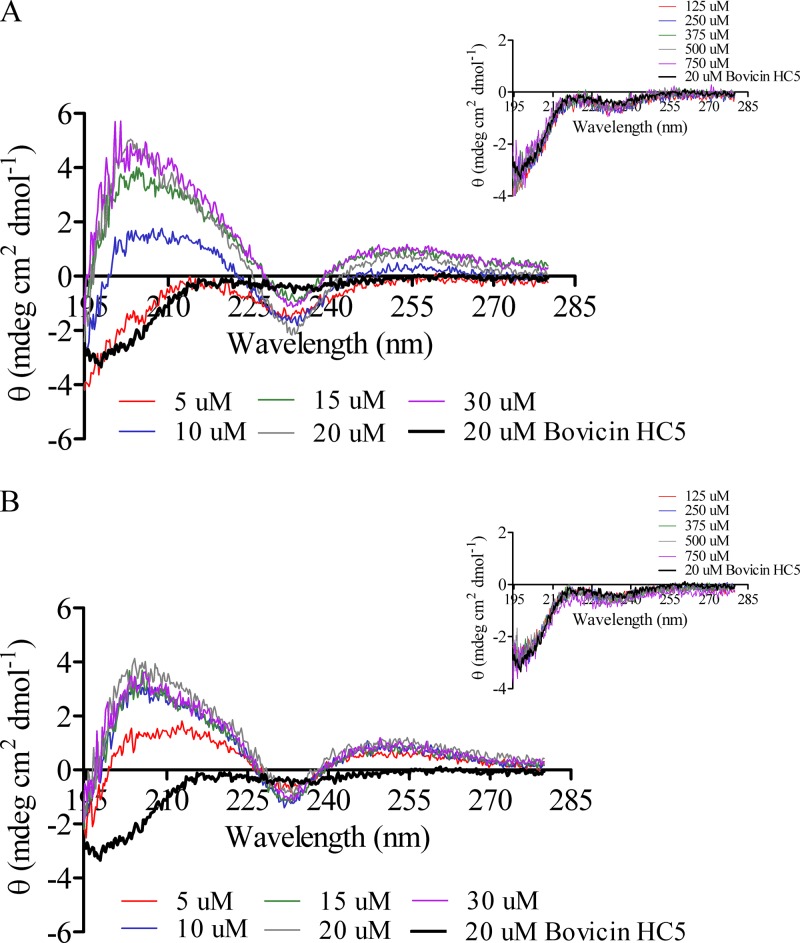
Fig 7.
CD spectra of bovicin HC5 in the presence of model membranes composed of DOPC (A) or DLPC/DMoPC (B) containing lipid II. Each spectrum was recorded for bovicin HC5 (20 μM) in buffer at pH 6 and in the presence of 5 to 30 μM lipid II. The samples were scanned from 195 to 280 nm at 20°C. Each spectrum represents an average of five recordings after subtraction of the blank spectrum from each bovicin HC5 spectrum. The insets show the spectra of bovicin HC5 in the presence of increasing concentrations of vesicles (125 to 750 μM expressed as lipid-Pi equivalents) without lipid II.

