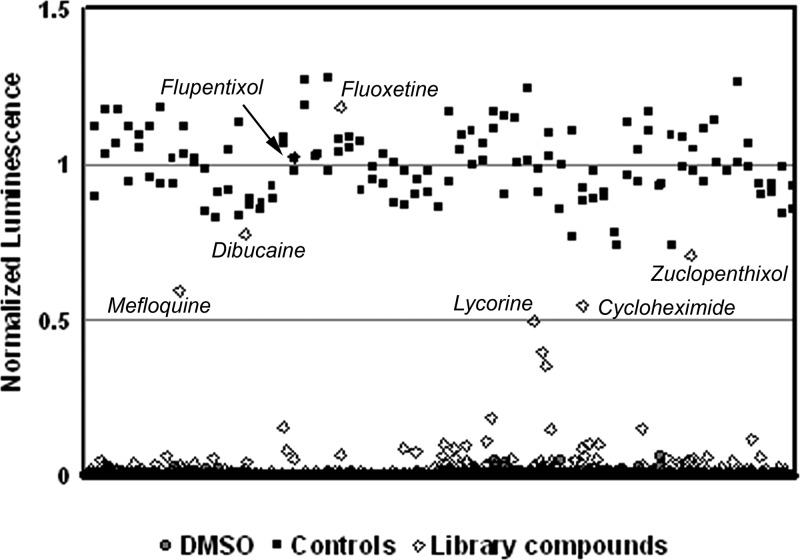
Fig 1.
Schema of the molecular screening approach. ATP-driven luminescence values are shown for the compounds in the Prestwick Chemical Library. Values are normalized for maximum luminescence observed on positive-control (guanidine HCl) wells in each 384-well plate. Negative-control wells on each plate included DMSO; note the low levels of luminescence. Primary hit compounds are indicated, which produced normalized luminescence levels above a threshold of 50% of the luminescence levels of the positive controls. All compounds were tested at a final concentration of 12.5 μM.

