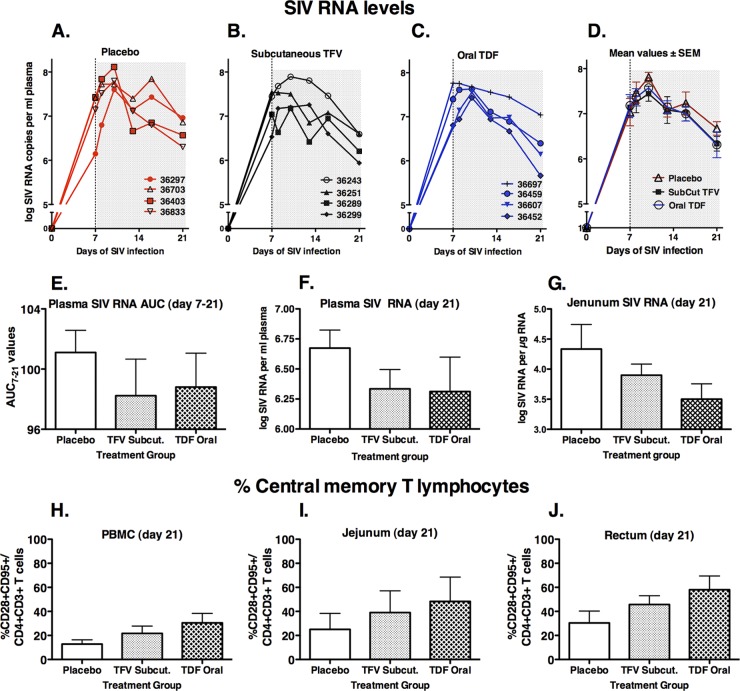
Fig 2.
Virus levels and immune markers in blood and tissues. (A to D) Individual and mean plasma SIV levels for the three groups of SIV-infected macaques during the 3 weeks of observation. (E) Values of area under the SIV RNA plasma concentration-versus-time curve from day 7 to 21 (AUC7–21). (F and G) SIV RNA levels in plasma and jejunal tissue at time of euthanasia on day 21. (H to J) Frequency of CD28+ CD95+ central memory cells among the CD4+ T lymphocyte population. All values on graphs D through J are means ± standard errors of the means (SEM) for four animals per group. Viral RNA data were first normalized via log transformation prior to statistical analysis.

