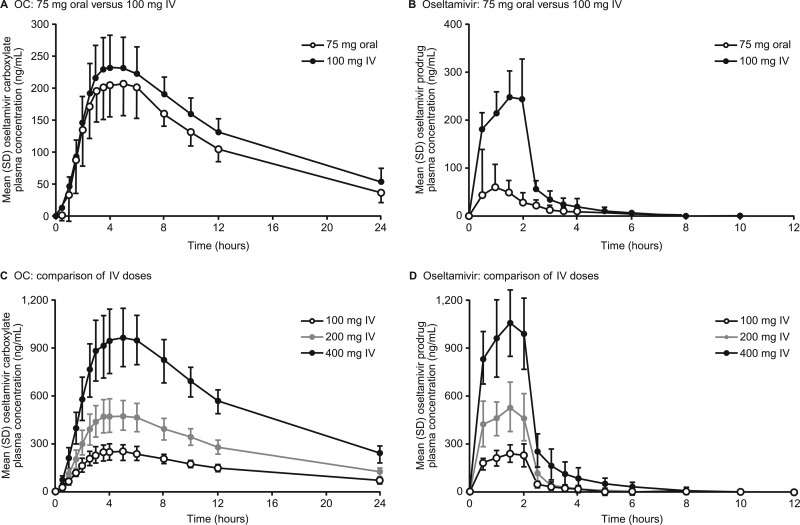
Fig 2.
Mean (standard deviation) plasma concentration-versus-time profiles of OC (A), oseltamivir after single i.v. 100-mg and single oral 75-mg doses of oseltamivir phosphate (B), OC after single i.v. doses of 100 mg, 200 mg, and 400 mg (C), and oseltamivir after single i.v. doses of 100 mg, 200 mg, and 400 mg (D).

