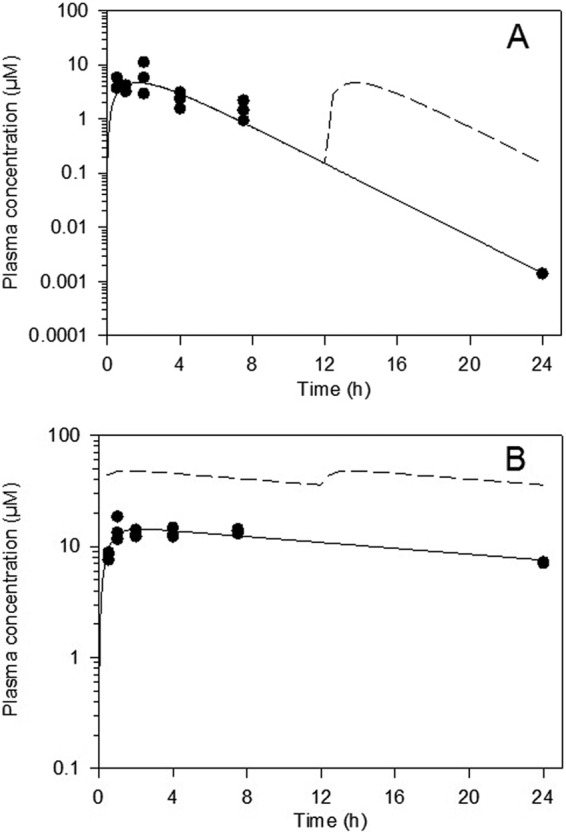
Fig 2.

Plasma concentrations of compound 2 (40 mg/kg) (A) and posaconazole (20 mg/kg) (B) following single oral administration to mice. Filled symbols represent measured concentrations (n = 3 samples per time point), while the solid line represents profiles fitted with a single-compartment model. The dashed line represents estimated plasma concentrations on day 20 after b.i.d. (q12h) administration.
