Figure 2.

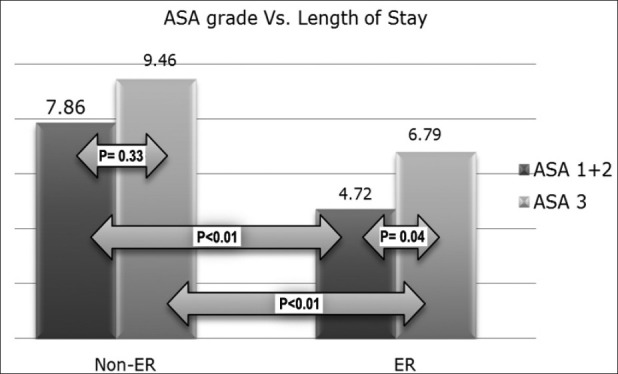
Bar graph showing hospital stay in days for the two groups (ASA 1+2 and ASA 3) within each cohort. Those with ASA 3 rating had a longer stay in both cohorts. Both groups had significantly shorter stay in the ER cohort

Bar graph showing hospital stay in days for the two groups (ASA 1+2 and ASA 3) within each cohort. Those with ASA 3 rating had a longer stay in both cohorts. Both groups had significantly shorter stay in the ER cohort