Figure 4.
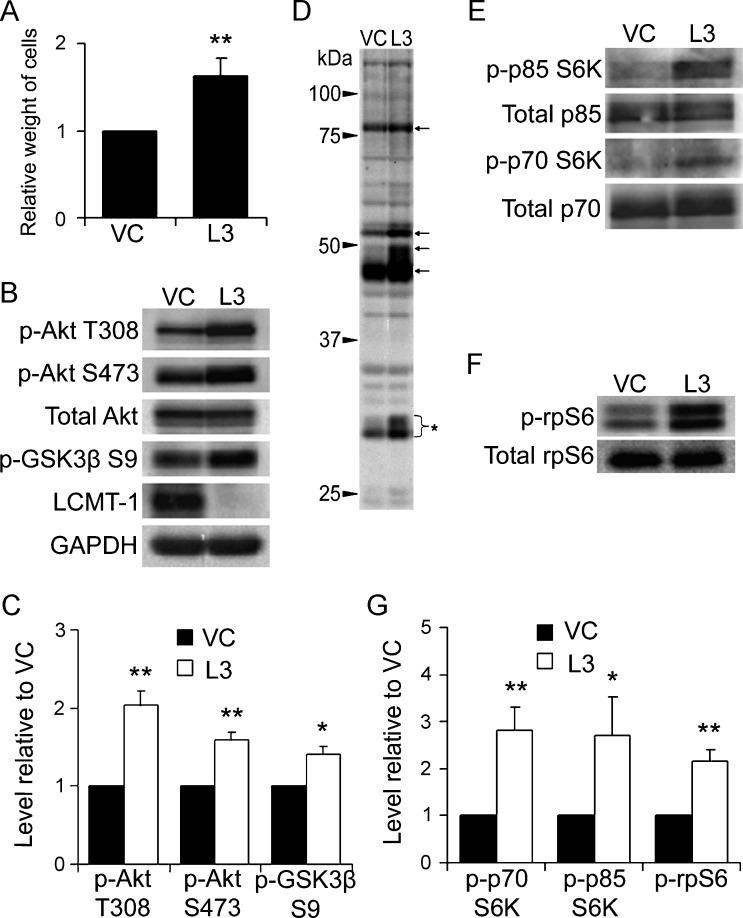
LCMT-1 knockdown activates Akt and S6K signaling in anchorage-independent conditions. (A) Equal numbers of VC and L3 cells were seeded on low-binding tissue culture dishes to analyze differences during anchorage-independent growth. After 1 week, suspension cells were weighed to assess growth. In the graph, data are presented as average fold change relative to VC for three independent experiments. (B) Lysates from VC and L3 suspension cells were analyzed by Western blot analysis for changes in activation of Akt. GAPDH and total Akt were used as loading controls. Western blot analysis for LCMT-1 confirmed the knockdown of LCMT-1 in suspension cultures. (C) Graph depicts the average levels of phospho-Akt T308, phospho-Akt S473, and phospho-GSK3β S9 in three independent immunoblot experiments as fold change relative to VC. (D) An anti-Akt phospho-substrate motif (R/K)X(R/K)XX(pT/pS) antibody was used to probe the VC and L3 suspension cell lysates. Arrows highlight some proteins with increased phosphorylation in the L3 cells relative to VC. Bracket with asterisk indicates phospho-rpS6, which is known to cross-react with this antibody. (E and F) Lysates were probed for changes in p70 and p85 S6K activation and rpS6 phosphorylation. Total p70 and p85 S6K and total rpS6 were used as loading controls. (G) Graph represents average fold change in the levels of phospho-p85, phospho-p70 and phospho-rpS6 in three independent immunoblot experiments relative to VC. Experiments were performed in triplicate and error bars in all panels represent SD. *P ≤ .05. **P ≤ .01.

