Figure 8.
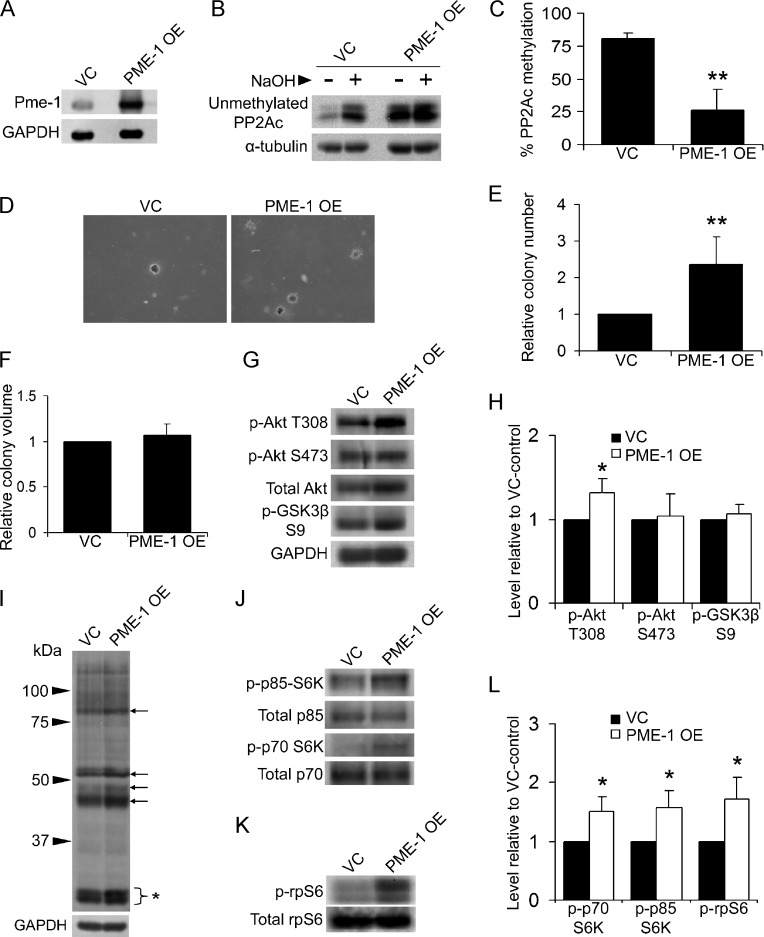
Overexpression of the PP2A methylesterase, PME-1, enhances transformation, and elicits similar biochemical changes as LCMT-1 suppression. (A) Lysates from HEKTERASB56γ cells stably expressing either an empty vector (VC) or excess PME-1 (PME-1 OE) were analyzed by Western blot analysis for the expression of PME-1. (B and C) PP2Ac methylation is reduced in the PME-1 OE cell line. (B) Equal volumes of lysates from VC and PME-1 OE lines were either treated with preneutralized base solution (- lanes; show unmethylated PP2Ac levels in cells) or base treated and then neutralized (+ lanes; 100% demethylated controls) before being analyzed by Western blot analysis for the level of unmethylated PP2Ac and α-tubulin (loading control). (C) Graph depicts the average percent methylation of PP2Ac in the lysates, calculated as described in the legend to Figure 2C. Error bars represent SD of three independent experiments. (D) Anchorage-independent growth of VC and PME-1 OE cells in soft agar. Photographs show small, single, representative fields within the agars. Average colony numbers (E) and average colony volumes (F) were determined, and data are shown in graphs as fold change relative to VC. Error bars represent SD of six independent experiments performed in triplicate. (G) Lysates from VC and PME-1 OE suspension cells were analyzed by Western blot analysis for changes in activation of Akt. GAPDH was used as a loading control. (H) Graph depicts the average fold change in the levels of phospho-Akt T308, phospho-Akt S473, and phospho-GSK3β S9 in three independent immunoblot experiments relative to VC. (I) Akt phospho-substrate antibody was used to probe the VC and PME-1 OE lysates. Arrows highlight some proteins whose phosphorylation increased in PME-1 OE cells. Bracket with asterisk indicates phospho-rpS6. (J and K) Lysates were probed for changes in p70 and p85 S6K activation and rpS6 phosphorylation. Total p70 and p85 S6K and total rpS6 were used as controls. (L) Graph represents the average fold change in the levels of phospho-p85, phospho-p70, and phospho-rpS6 in three immunoblot experiments relative to VC. Error bars represent SD of three independent experiments. For all graphs: *P ≤ .05. **P ≤ .01.

