Figure 4.
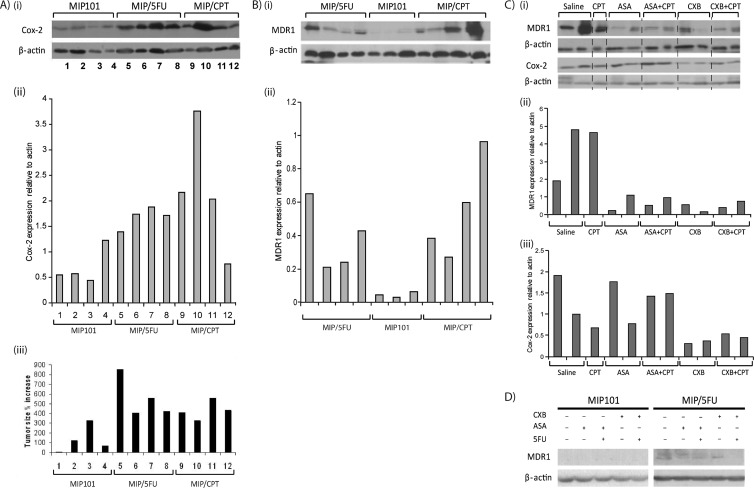
Expression of COX-2 and MDR-1 in tumor xenografts of sensitive and resistant CRC cells. (A) Basal levels of COX-2 expression in MIP101 (samples 1–4), MIP/5-FU (samples 5–8), and MIP/CPT (samples 9–12) tumor xenografts treated with saline by immunoblot analysis (i) and relative levels of COX-2 (ii) normalized to β-actin (densitometry); (iii) bar diagram shows percent increase in tumor size of these same tumors. (B) MDR-1 expression of MIP101, MIP/5-FU, and MIP/CPT tumor xenografts assessed by immunoblot analysis (i) and relative levels of MDR-1 (ii) normalized to β-actin. (C) MDR-1 and COX-2 expression in MIP/CPT tumor xenografts after treatment with indicated drugs, (i) by immunoblot analysis, with relative levels of MDR-1 (ii) and COX-2 (iii) normalized to β-actin. (D) MIP101 and MIP/5-FU cells were assessed for MDR-1 expression after treatment with different drug combinations in vitro by immunoblot analysis. In all cases, β-actin was used as a loading control.

