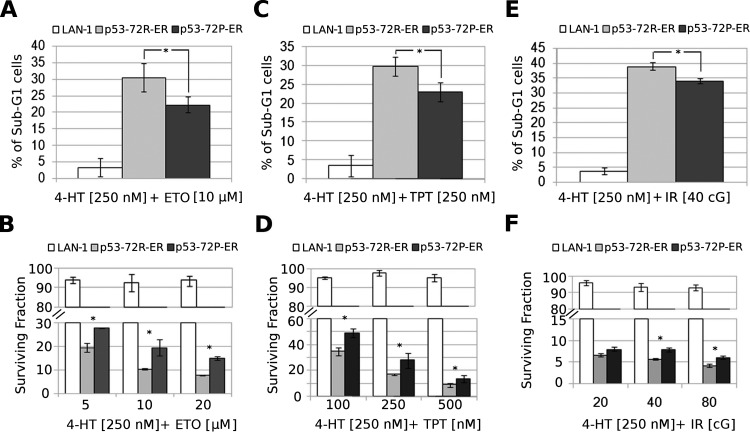
Figure 2.
Frequency of apoptotic (A, C, and E) and clonogenic cells (B, D, and F) in cytotoxic- or IR-treated LAN-1 (parental, p53-72R, or p53-72P) cells on 4-HT-dependent activation of p53. In B, D, and F, histograms show residual colony formation of cytotoxic- or IR- and 4-HT-treated LAN-1 (parental, p53-72R, or p53-72P) cells compared with that of cells treated with cytotoxic drug or IR only. Results are presented as the mean ± SD of three experiments performed in triplicate. *P < .05.

