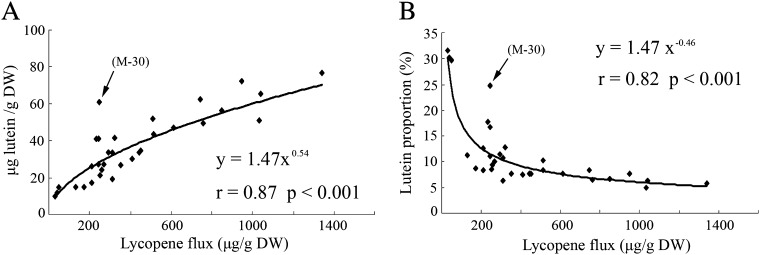
Fig. 4.
Correlation between lutein content (A) or lutein proportion (B) and lycopene flux. 32 M callus lines, including wild type, empty-vector control, negative control, and 29 ECMs, are used for analysis. Lycopene flux is represented by the total content of violaxanthin, lutein, α-carotene, β-carotene, and lycopene, and lutein proportion (%) is relative to this total content. Pearson correlation (r) and statistical significance (P) are determined using SAS statistical software. The arrows show a significantly deviating line (M-30).

