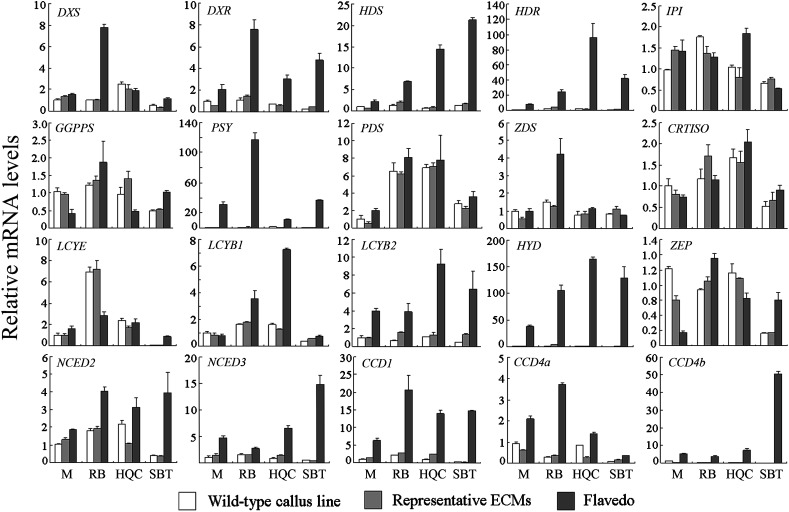
Fig. 8.
Transcriptional analysis of genes encoding enzymes for isoprenoid and carotenoid metabolism. Transcript levels are expressed relative to M wild type. For one genotype at least five ECMs were analysed, and data of only one ECM was shown due to their similar expression trend. All data are presented as means ±SD from three replicate experiments.

