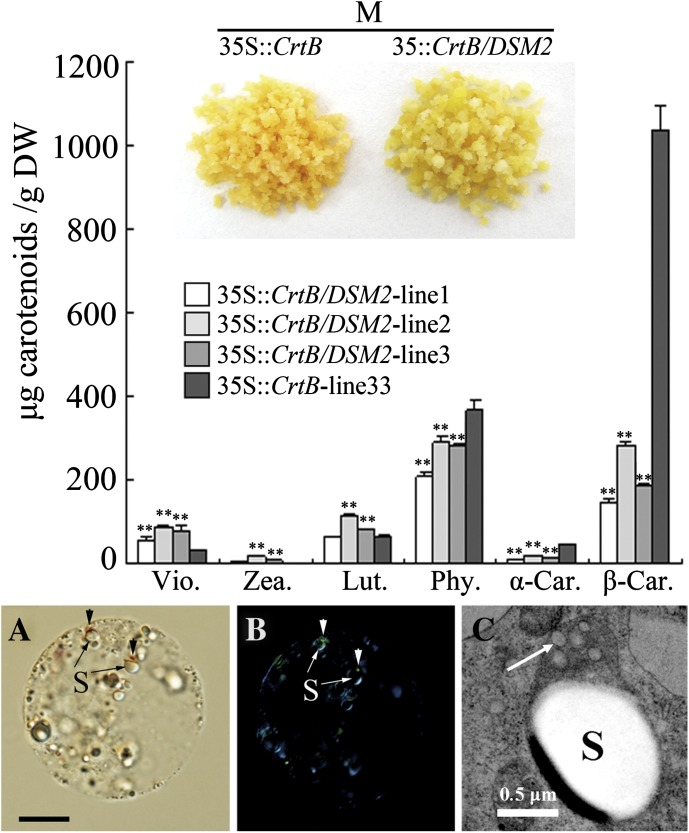
Fig. 9.
Carotenoid analysis and cellular inspection of co-transformed lines (35S::CrtB/DSM2) and M-33 (35S::CrtB). Via., violaxanthin; Zea., zeaxanthin; Lut., lutein; Phy., phytoene; α-Car., α-carotene; β-Car., β-carotene. Values and bars represent the means and ±SD (n=3 replicate experiments), respectively. ** Indicates that the values are significantly different compared with M-33 at the significance level of P <0.01. (A) Normal light microscopy. (B) Polarization microscopy (arrows show the dot-crystals attaching to the amyloplasts). (C) Ultrastructure of amyloplast (arrow shows the electron-transparent plastoglobules; S, starch granule). The bar in picture (A) represents 10 μm.

