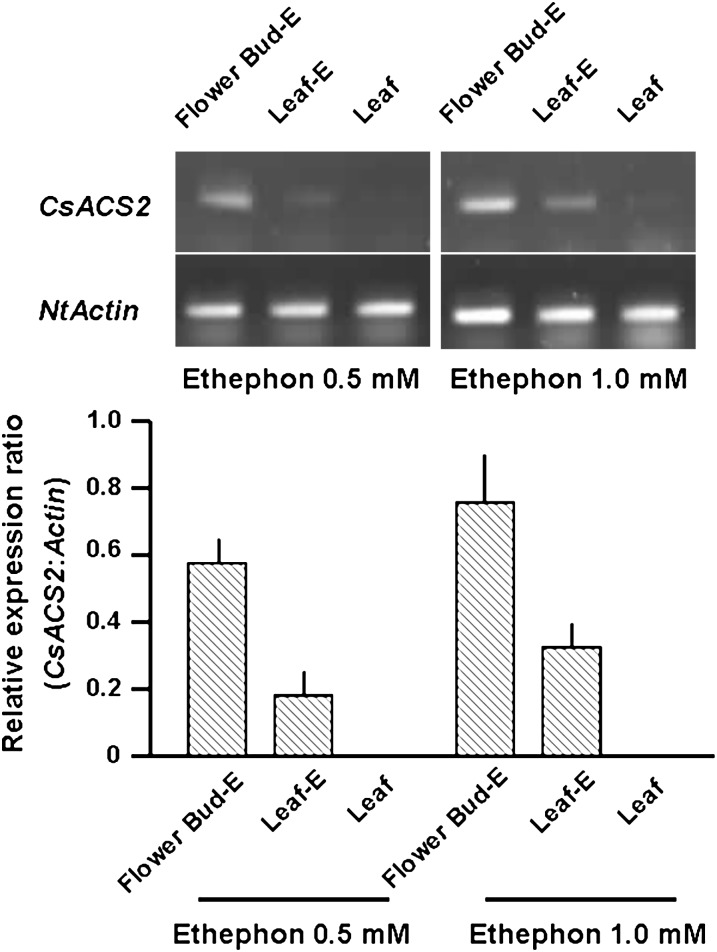
Fig. 3.
RT-PCR gel images (upper) and relative expression ratio (bar graph) of CsACS2 normalized to the Actin gene internal control in an ethephon-treated PM transgenic plant (TM-3). Leaf, untreated lower leaf; Flower Bud-E, ethephon-treated flower bud; Leaf-E, leaf adjacent to the ethephon-treated flower bud. Significance at P ≤ 0.05 is indicated by mean standard error bars (n=3).

