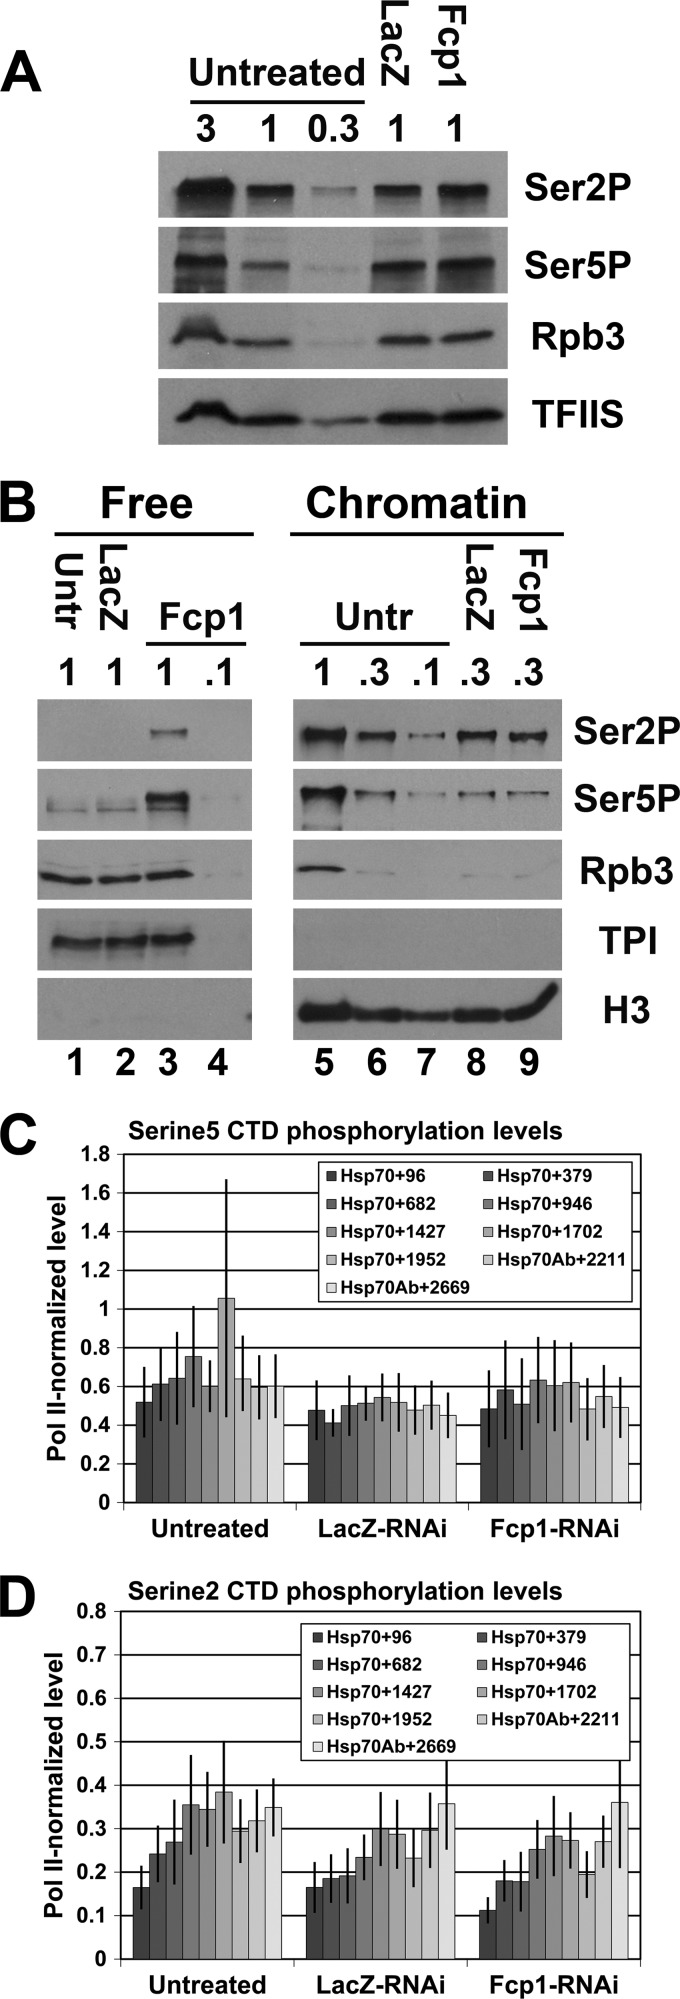
Fig 3.
Fcp1 knockdown does not significantly change phosphorylation level of Pol II on the Hsp70 gene. (A) Western blots of whole-cell extracts from untreated, LacZ-RNAi, and Fcp1-RNAi cells probed with antibodies for phosphorylated CTD serine 2 (3E10 at 1:250; EMD Millipore), phosphorylated CTD serine 5 (3E8 at 1:250; EMD Millipore), Rpb3 (1:1,000; lab stock loading control), and TFIIS (1:3,000; lab stock loading control). The relative amount loaded is indicated (where 1 = 6 × 10⁵ cells). (B) Western blots of free and chromatin-bound protein fractions from untreated, LacZ-RNAi, and Fcp1-RNAi cells probed with antibodies for phosphorylated CTD serine 5 (3E8 at 1:250; EMD Millipore), phosphorylated CTD serine 2 (3E10 at 1:250; EMD Millipore), Rpb3 (1:1,000; lab stock loading control), triose phosphate isomerase (1:1,000; lab stock loading control) and histone H3 (ab1791 at 1:500; Abcam). The relative amount loaded is indicated (where 1 = 1 × 10⁶ cells). (C and D) ChIP results of the serine 5- and serine 2-phosphorylated Pol II CTD enrichment relative to Pol II enrichment on the Hsp70 gene in untreated, LacZ-RNAi, and Fcp1-RNAi S2 cells at 10 minutes of HS. The legend indicates the midpoint of each PCR fragment. The y axis shows the ratio of the percentages of input DNA immunoprecipitated (error bars indicate standard error of the mean of at least three biological replicates).

