Fig 8.
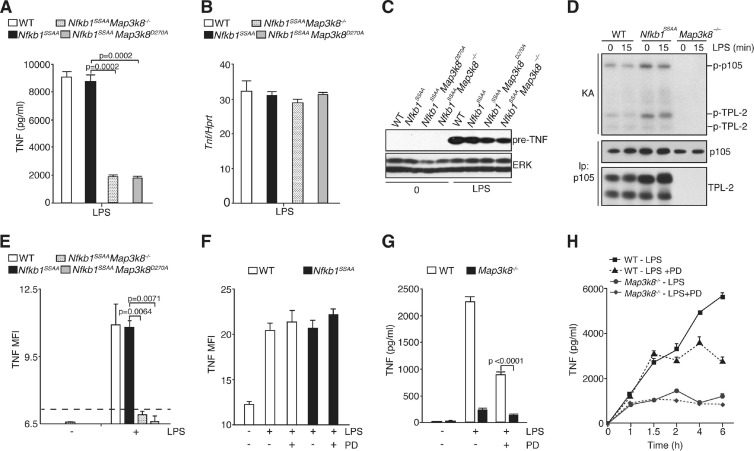
Nfkb1SSAA mutation does not inhibit LPS induction of sTNF production. (A and B) BMDM were cultured in triplicates and stimulated with LPS for 6 h (A) or 1 h (B). The Tpl2D270A/D270A genotype is shown here and subsequently as Tpl2D270A. In panel A, TNF in culture supernatants was assayed by ELISA (error bars, SEM). In panel B, Tnf mRNA was quantified as described in the legend of Fig. 3A (error bars, SEM). (C) Lysates were prepared from unstimulated or LPS-stimulated BMDM of the indicated genotypes and immunoblotted. (D) p105 was quantitatively immunoprecipitated from BMDM lysates of the indicated genotypes with or without LPS stimulation (100 ng/ml) and subjected to an in vitro kinase assay (KA). 32P-labeled bands were revealed by autoradiography after SDS-PAGE. The amounts of TPL-2 and p105 isolated were determined by immunoblotting. (E) BMDM were stimulated for 1 h with LPS (1 μg/ml) and fixed, and surface pre-TNF expression was assayed by flow cytometry. The dotted line shows the mean fluorescence intensity (MFI) for negative-control antibody staining. (F) WT or Nfkb1SSAA/SSAA BMDM were stimulated with LPS (1 μg/ml) with or without PD184352 (PD) for 1 h, and surface pre-TNF expression was determined by flow cytometry. (G) BMDM were cultured for 6 h with LPS with or without PD184352 or with control medium (0). Culture supernatants were assayed for TNF (triplicate cultures; error bars, SEM). (H) BMDM were stimulated for the indicated times with LPS with or without PD or with control medium (0). PD was added 1 h before LPS stimulation. TNF in culture supernatants was assayed (error bars, SEM). All results are representative of at least three independent experiments.

