
Fig 7.
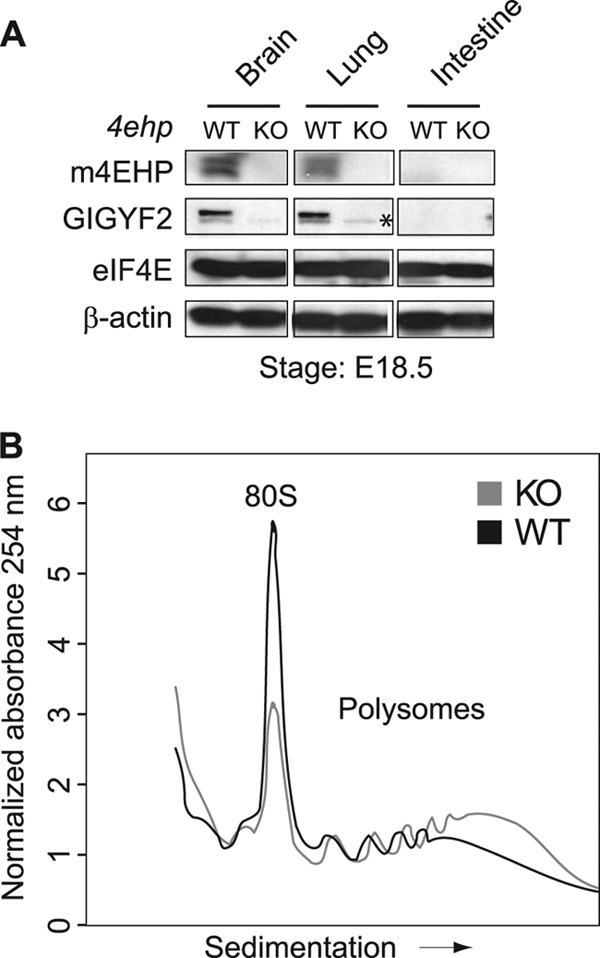
Tissue distribution of m4EHP-GIGYF2 proteins and polysome profile of wild-type and 4ehp knockout mice. (A) Immunoblotting of m4EHP, GIGYF2, and eIF4E proteins in 4ehp WT and KO tissues isolated from mice at E18.5. β-Actin was used as a loading control. An asterisk denotes a nonspecific band. (B) Polysome profiles of WT and 4ehp KO whole-brain lysates. Brain lysates were sedimented on 10% to 50% sucrose gradients. A254 was continuously recorded. Polysome profiles were normalized with the area under the curve. 80S denotes the monosome peak.