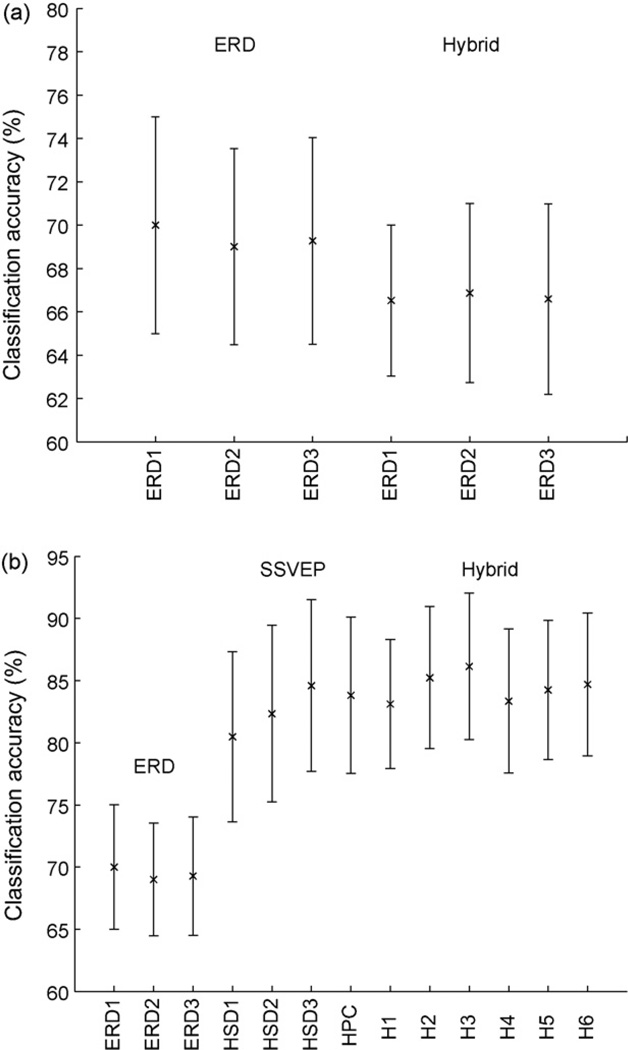
Fig. 5.
Left: Error bars indicating the ERD performance in the ERD-only and hybrid runs (analysis 4). The crosses mark the mean classification accuracy, while the bars denote the 95% confidence intervals around the means. Right: Classification performance in the three conditions ERD-only, SSVEP-only, and hybrid (analysis 6).

