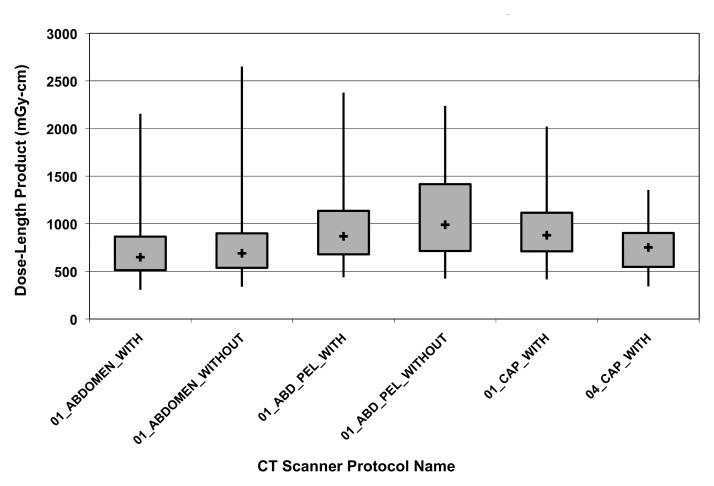
Figure 3:
Box plot shows DLP variation of abdominal and pelvic CT performed with different CT units stratified by scan protocol name. The median (+), 25th and 75th percentiles (box), and minimum and maximum values (vertical lines) are shown. Institutional data capture identifies variation for targeted protocol standardization and dose optimization.

