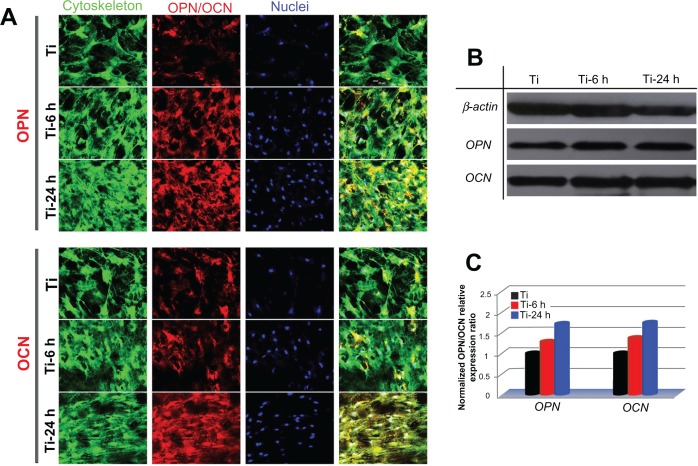
Figure 11.
Osteopontin and osteocalcin protein expression. (A) Upper panels show osteopontin immunofluorescence results for cells incubated on samples for 14days and lower panels show those for osteocalcin. green (actin cytoskeleton), blue (nuclei), red (osteopontin, osteocalcin) and yellow (merged color of green and red). (B) Protein expression of osteopontin and osteocalcin was detected by Western blot analysis. (C) Gray levels of osteopontin and osteocalcin protein bands were normalized to the β-actin level.

