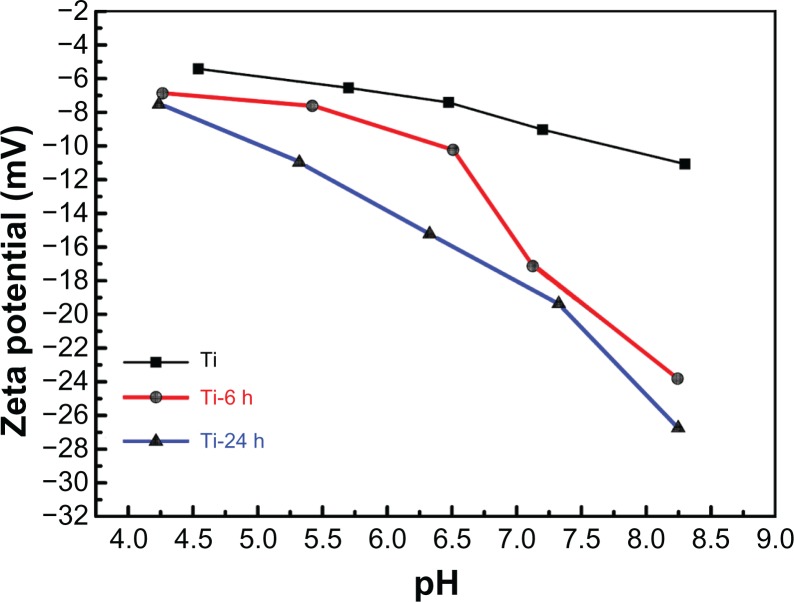
Figure 5.
Surface zeta potential measurement.
Notes: The zeta potentials versus pH values for each individual sample are shown. All the curves show a descending trend with increasing pH. The zeta potentials become more negative in the order of pure Ti, Ti-6 h, and Ti-24 h at the same pH value.
Abbreviations: Ti, control titanium surface; Ti-6 h, small size nano-sawtooth surface, treated with 30 wt% H2O2 for 6 hours; Ti-24 h, large size nano-sawtooth surface, treated with 30 wt% H2O2 for 24 hours.

